What is Fundamental Analysis?
Fundamental Analysis refers to the evaluation of an asset or company’s true value or long-term potential by studying “intrinsic value factors” such as macroeconomic environment, industry trends, and company financial statements.
Key elements of fundamental analysis include:
- Macroeconomic indicators
- GDP growth rate, inflation rate, unemployment rate, interest rate levels
- Government policies, monetary policies (e.g., interest rates, quantitative easing)
- Industry prospects and competitive landscape
- Supply and demand relationships within the industry, technological trends, threat of new entrants
- Market growth potential, barriers to entry
- Corporate financial condition
- Income statement (revenue, net profit, gross margin, etc.)
- Balance sheet (assets, liabilities, net assets, etc.)
- Cash flow statement (operating cash flow, free cash flow)
- Management and business strategy
- Experience and integrity of the corporate leadership team
- Company strategy, operational efficiency, innovation capability
The goal of fundamental analysis is to determine whether an asset is undervalued or overvalued by the market and to predict its potential value increase in the medium to long term.
What is Technical Analysis?
Technical Analysis focuses on “historical behavior” data such as market prices, trading volumes, chart patterns, and technical indicators, aiming to find price trends, buy/sell signals, and market sentiment.
Main tools and methods of technical analysis include:
- Price trend charts and candlestick charts
- Candlesticks: body, upper shadow, lower shadow
- Moving averages: short-term/medium-term/long-term moving averages
- Trends and support/resistance
- Trend lines, channels, Fibonacci retracement lines
- Support and resistance lines as important references for buying/selling
- Technical indicators
- Relative Strength Index (RSI), Stochastic Oscillator
- MACD, Bollinger Bands, volume indicators
- Pattern recognition and pattern signals
- Classic patterns: head and shoulders top/bottom, double top/bottom, triangles, flags, etc.
- Reversal or continuation patterns, identifying trend direction through pattern recognition
The advantage of technical analysis is its ability to quickly respond to market price changes, suitable for short to medium-term traders to capture opportunities.
Fundamental vs Technical: Comparison and Limitations
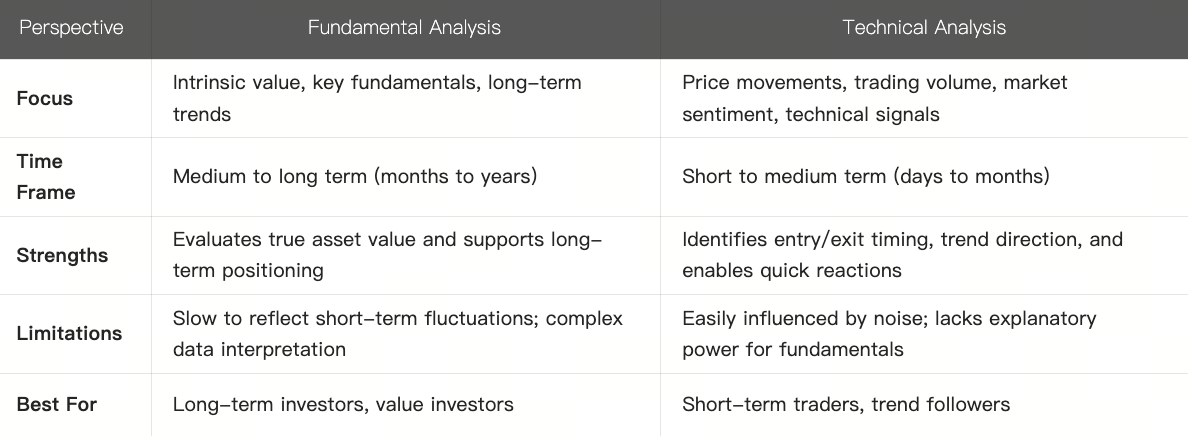
In other words, relying solely on fundamentals may miss short-term opportunities; relying solely on technicals may overlook inherent risks of the asset.
How to Combine the Two Approaches?
To make more comprehensive and robust market decisions, it is recommended to adopt a “hybrid analysis” approach, integrating the advantages of both. Here are some common integration strategies:
- Use fundamentals for underlying judgment + technicals for timing entry points
First use fundamentals to judge asset valuation and long-term trends, then use technical indicators to determine exact entry and exit points if the asset shows potential. - Trend confirmation + Valuation safety margin
After identifying trend direction with technicals, verify if the asset’s valuation has a safety margin through fundamentals. - Staged position strategy
Enter and exit positions in batches: long-term positions for fundamentally supported assets; add or reduce positions when technical trends appear. - Hedging and risk control
Make fundamental allocations for main assets, while using technical tools for hedging or short-term operations on volatile portions.
Practical Demonstration (Case Study)
Suppose we observe the following scenario in a stock/crypto asset:
- Fundamental analysis: The company has a 3-year revenue CAGR of 18%, with a stable net profit margin around 15%; debt-to-asset ratio below 40%, healthy cash flow. The industry is expected to grow at an average rate of 10% over the next two years.
- Technical trends: Price has formed an ascending triangle pattern over the past three months, breaking out with increased volume above a long-term resistance level (e.g., $50). Trading volume increased 2.5 times compared to the previous week’s average; RSI rose from 45 to 65, entering an upward channel but not yet overbought.
In this case, we can conclude that the asset may be entering a new uptrend. Thus, we can:
- Buy on dips near the breakout point (49 - 50 USD range), setting a stop-loss about 5% below the previous support level (47.5 USD);
- If the price stabilizes above $50 with sustained volume, add to the position in batches every 5% - 8% price increase;
- When technical indicators show divergence (e.g., RSI making lower highs while price makes higher highs) or MACD shows a death cross, gradually reduce positions, selling in stages (25% each time).
Through this case study, you can see how combining fundamental data (growth rates, debt ratio) with technical indicators (volume, RSI, support/resistance levels) can form a quantifiable trading decision system in practice.
Fundamental analysis and technical analysis each have their focus: fundamentals look at the intrinsic value and future trends of assets, while technicals capture price movements and entry/exit signals. Using them in combination can improve the accuracy of judgments and risk control capabilities.