Identifying, Evolving, and Judging Market Trend Cycles
This lesson expands our perspective to understand the evolution and cyclical patterns of market trends. You'll learn to identify trends, interpret cycle phases, and master operational strategies for different cycles. Equipping you to be more flexible and discerning across diverse market conditions.
The Status of Trends and Cycles in the Market
In financial markets, trends and cycles are distinct yet interconnected structures:
-Trend refers to the unidirectional movement of price (upward, downward, or sideways) over a certain period.
-Cycle refers to the complete process of market movement from low to high and back, including multiple trend phases.
Understanding trends and cycles helps you stay aligned with the broader market and avoid impulsive decisions driven by short-term fluctuations.
Classification and Characteristics of Market Trends
Trends can be classified by time scale and magnitude, with common types including:
Primary / Major Trend
- Lasts longer, possibly for months or years.
- Driving forces often come from macroeconomics, policy changes, industry reforms, etc.
Intermediate / Secondary Trend
- Lasts from several weeks to several months.
- Often represents adjustment or rebound phases within the primary trend.
Minor / Short-Term Trend
- Lasts from several days to several weeks.
- Strongly influenced by market sentiment, news, technical breakthroughs, etc.
Characteristics of trends include: trends have inertia and tend to continue once formed; trends may extend or reverse; trends include adjustment phases (pullbacks, consolidations).
Market Cycle Phase Division
A market cycle typically includes four phases: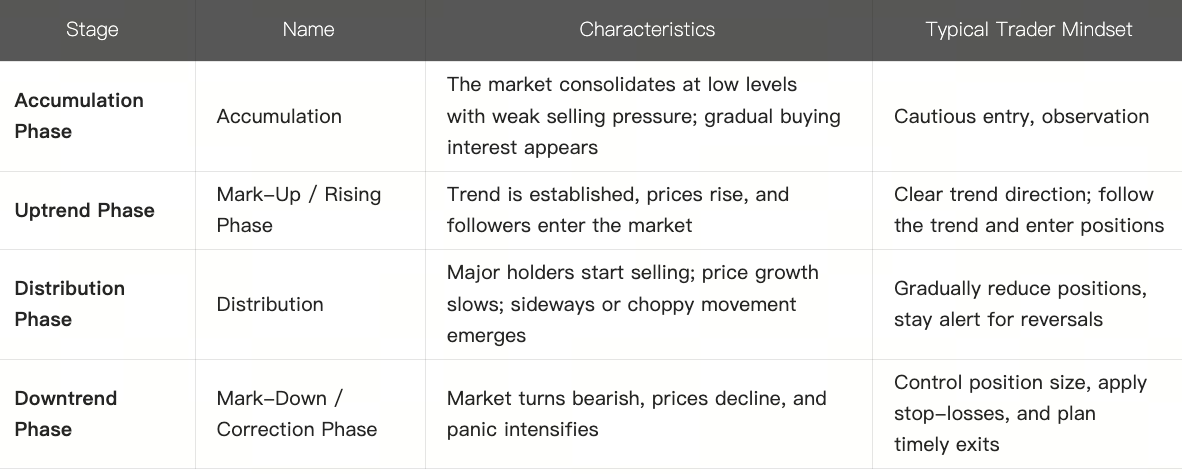
This framework applies to stocks, crypto assets, commodities, and other markets. Cycles are rarely symmetrical or smooth; trends may overlap, intersect, and be disrupted by external factors (policies, macroeconomics, liquidity).
Methods for Identifying Trends and Cycles
1. Trendlines and Channels
Draw uptrend or downtrend lines by connecting key highs or lows to assist in judging price direction. A valid breakout of the trendline may indicate a trend change.
2. Moving Average Systems
Crossovers of moving averages (e.g., 50-day, 200-day) and price deviations from moving averages help assess trend strength.
3. Support/Resistance Zones
Identifying critical support/resistance areas in trends guides buying on dips or selling on rallies.
4. Volume and Volume Structure
Volume should expand in tandem with an uptrend; shrinking volume may indicate a weakening trend.
5. Technical Indicator Assistance
Examples include MACD trend direction, ADX strength indicator, RSI trend status, etc., used to assist in judging trend continuation or weakness.
6. Multi-timeframe Trend Comparison
Confirm direction on higher timeframes (e.g., weekly/monthly) before timing trades on medium/short-term trends to avoid opposing the broader market.
Operational Strategies in Different Cycles
Upward Primary Trend + Buy on Mid-Short Term Pullbacks
When the primary trend is upward, mid-short term pullbacks are entry opportunities. Consider phased buying on dips with reasonable stop-losses.Downward Primary Trend + Sell on Rebounds or Avoid
If the primary trend is clearly downward, rebounds may be selling/short-selling opportunities. Avoid the market if risks are too high.Sideways Consolidation Period
With no clear trend, trading becomes more challenging. Reduce position sizes, opt for swing/range trading, and enforce strict risk control.Trend End Phase
Near trend peaks or bottoms, be alert to trend exhaustion signals, such as extreme price deviations from trendlines or abnormal volume patterns.
Practical Case Analysis
Suppose we analyze a crypto asset’s movement by combining trend and cycle judgments:
- On a monthly timeframe, the asset is in an uptrend, entering a rising phase;
- On a weekly timeframe, we observe the price approaching a resistance zone with diminishing volume;
- On a daily timeframe, we see a short-term pullback, with prices falling to the trendline support area;
- At this point, we might consider entering the support area, setting a stop-loss below the trendline; if the trend continues, we can add to the position after the pullback ends; if the price breaks below the trendline, it’s seen as a trend reversal signal, and we should exit.
This case demonstrates the approach of judging trends and timing operations across different cycle levels.
Conclusion
Trends and cycles are two major manifestations of market structure. Trends reflect the direction of price movement, divided into long-term, medium-term, and short-term; cycles embody the circulation of trends, including accumulation, uptrend, distribution, and downtrend phases. Through tools such as trendlines, moving averages, volume, and support/resistance, combined with multi-timeframe analysis, trends and cycles can be effectively identified. In different cycles, investors need to adjust strategies, align with the broader trend to optimize decision-making.
Lesson 1:Fundamental Concepts and Differences Between Trading and Investing
Lesson 2:Market Analysis Tools — Fundamental vs Technical Analysis
Lesson 3:How to Apply Fundamental and Technical Analysis to Decision Making
Lesson 4:Identifying, Evolving, and Judging Market Trend Cycles
Lesson 5:Market Psychology and Emotion-Driven Dynamics
Related Courses

Guide to Gate Dual Currency Products

The Beginner's Guide to Blockchain-based Airdrops

Introduction to Meme Tokens

Learn about web3 data and analytics

Crypto Mining Equipment