
Key Takeaways
-
ASTER rebounds strongly, gaining nearly 10% as the broader crypto market recovers, with price holding above key support near $0.55.
-
Harmonic structure remains bullish in the short term, with the Bearish Shark pattern allowing upside continuation toward resistance.
-
A breakout above $0.687 (50-day MA) could open the path toward the $0.828 target, while failure to hold support may invalidate the setup.
The broader cryptocurrency market is showing signs of relief today after a sharp sell-off earlier this week. Bitcoin (BTC) briefly dipped to the $74,000 region before staging a rebound above $78,000, gaining nearly 3% on the day. Ethereum (ETH) has also followed suit, climbing around 4.4% in the past 24 hours.
Amid this recovery, several altcoins have turned green, including the decentralized exchange (DEX) token Aster (ASTER). The token has surged over 8%, trimming its monthly losses to around 21%. More importantly, ASTER’s price action is now flashing a familiar technical setup that hints at further upside potential.
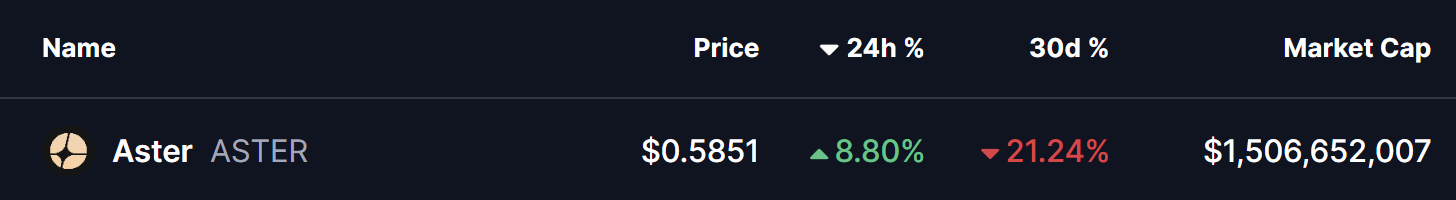
Source: Coinmarketcap
Technical Patterns Hint at Upside Momentum
From a technical perspective, ASTER’s daily chart reveals the formation of a Bearish Shark harmonic pattern, a widely tracked structure in harmonic trading. While the pattern is traditionally associated with a possible reversal once fully completed, it often allows for short-term bullish continuation as price advances toward the C-point.
As seen on the chart, the O-X-A-B structure has already been completed, with price finding support near the B-point around the $0.55 region. ASTER is currently trading near $0.584, showing early signs of stabilization after the recent sell-off.
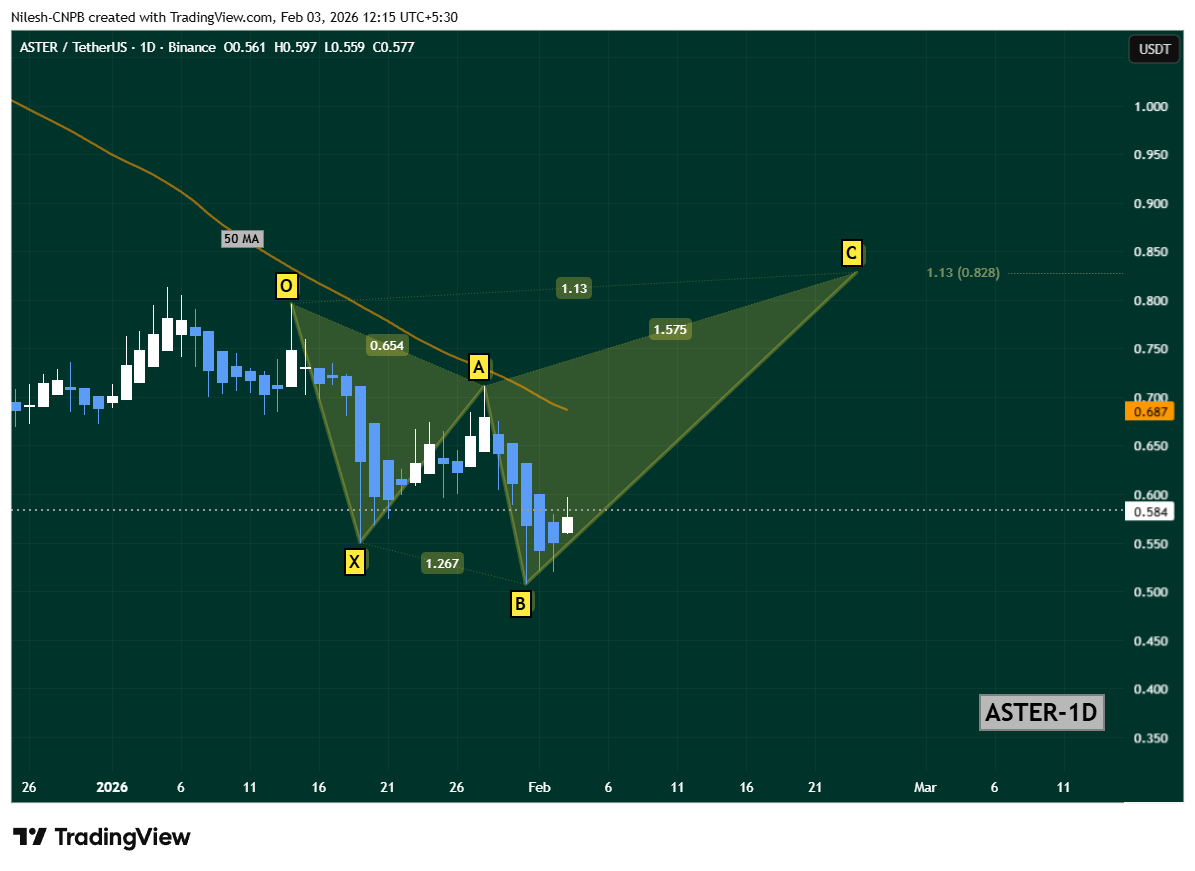
Aster (ASTER) Daily Chart/Coinsprobe (Source: Tradingview
The immediate hurdle for bulls remains the 50-day moving average, positioned around $0.687. This level has acted as a dynamic resistance in recent weeks, capping upside attempts and triggering pullbacks.
What’s Next for ASTER?
A decisive daily close above the 50-day MA ($0.687) would be a key technical signal, strengthening the short-term recovery narrative. Such a breakout could attract fresh momentum buyers and set the stage for a broader upside move.
If bullish momentum sustains, the harmonic projection points toward the C-point near $0.828, which aligns with the 1.13 Fibonacci extension of the Shark pattern. This level represents a potential upside target in the coming sessions, provided overall market sentiment remains supportive.
Despite the improving technical picture, downside risks have not disappeared. A failure to hold the B-point support zone could invalidate the bullish continuation scenario. In that case, ASTER may enter a period of extended consolidation or face renewed downside pressure before any meaningful recovery attempt.
Disclaimer: The views and analysis presented in this article are for informational purposes only and reflect the author’s perspective, not financial advice. Technical patterns and indicators discussed are subject to market volatility and may or may not yield the anticipated results. Investors are advised to exercise caution, conduct independent research, and make decisions aligned with their individual risk tolerance.
About Author: Nilesh Hembade is the Founder and Lead Author of Coinsprobe, with over 5 years of experience in the cryptocurrency and blockchain industry. Since launching Coinsprobe in 2023, he has been providing daily, research-driven insights through in-depth market analysis, on-chain data, and technical research.
Disclaimer: The information on this page may come from third parties and does not represent the views or opinions of Gate. The content displayed on this page is for reference only and does not constitute any financial, investment, or legal advice. Gate does not guarantee the accuracy or completeness of the information and shall not be liable for any losses arising from the use of this information. Virtual asset investments carry high risks and are subject to significant price volatility. You may lose all of your invested principal. Please fully understand the relevant risks and make prudent decisions based on your own financial situation and risk tolerance. For details, please refer to
Disclaimer.
Related Articles
Bitcoin Reclaims Prices Above $70,000 at $72,000, Will it Reclaim $76,000 or Hit $60,000 Next?
Bitcoin reclaims prices above $70,000 at $72,000.
Will the price of BTC go bullish and surge above $76,000 next?
There is also a bearish possibility for BTC to drop to $60,000 next instead.
The crypto community is pleased to see the price of Bitcoin (BTC), the pioneer crypto asset, recla
CryptoNewsLand13m ago
Bitcoin breaks through $72,000; the ascending triangle pattern suggests a target of $80,000
Bitcoin’s price rose 6.7% on Wednesday to $72,379, influenced by easing tensions between the US and Iran and falling oil prices. Investor risk-avoidance sentiment eased, driving crypto and traditional assets to rise in tandem. Technical indicators show strong upward momentum for Bitcoin; if it breaks through $74,500, it could further test the $76,000 or $80,000 targets.
GateNews17m ago
6-week new high! Bitcoin ETF inflows of $470 million, analyst: a breakout move is brewing
U.S. spot Bitcoin ETFs pulled in $471 million on Monday, setting a six-week high and signaling a rebound in institutional investor confidence. Despite the strong inflows, geopolitical and economic uncertainties could still affect the rally. Analysts said that if broad economic variables improve, the crypto market may see upward momentum again.
CryptoCity19m ago
Crypto Market Rebounds With Notable Gains Across Leading Assets
The crypto market has seen a 23.11% increase in trading volume, with Bitcoin and Ethereum rising by 4.37% and 6.38%, respectively. Notable gainers include $CATX, $DOGO, and $PENGU, while DeFi and NFT sectors also grew significantly. Additionally, Morgan Stanley launched a BTC ETF, and FDIC proposed stablecoin regulation.
BlockChainReporter57m ago
Bitcoin spikes to $72k but then shows a “fake bull”? With the ceasefire agreement layered on top and options expiring, undercurrents are roiling in the market
After the U.S. and Iran reached a ceasefire agreement, Bitcoin quickly rebounded to $72,000, indicating how sensitive the market is to macro events. However, derivatives market data shows that this rally was mainly driven by easing hedging sentiment rather than new inflows, and that implied volatility in the options market has fallen, suggesting that near-term risks are being released. The next few days will be critical: a large amount of Bitcoin and Ethereum options are expected to expire, which could influence the direction of the market.
GateNews1h ago
