Key Takeaways
-
AAVE has dropped nearly 23% in 30 days, but price is now holding a major long-term support zone between $113–$129.
-
The weekly chart shows a potential double bottom pattern, signaling a possible trend reversal if support continues to hold.
-
A reclaim of the 100-week moving average near $137.8 could strengthen bullish momentum and open the path toward $378–$400 resistance.
The broader altcoin market has come under heavy selling pressure over the past few days, with sentiment deteriorating rapidly across major assets. Ethereum (ETH) has plunged more than 28%, setting the tone for the wider market. Unsurprisingly, Aave ($AAVE) hasn’t been spared, shedding nearly 23% over the past 30 days.
While short-term sentiment remains fragile, a closer look at AAVE’s weekly chart suggests price has now reached a technically important area — one that could serve as a foundation for a potential bounce if buyers continue to step in.
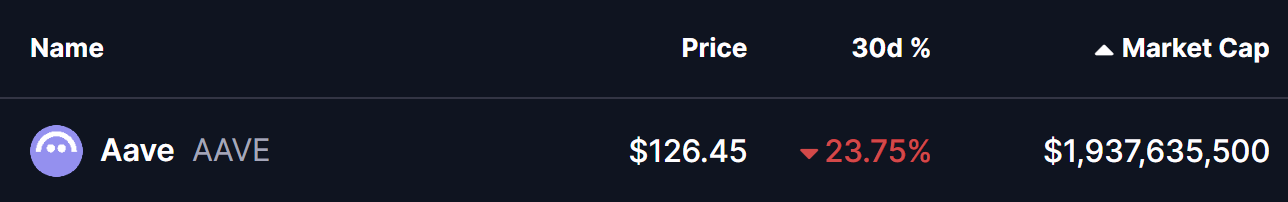
Source: Coinmarketcap
Double Bottom Pattern in Play?
On the weekly timeframe, AAVE appears to be forming a potential double bottom pattern, a classic bullish reversal structure that often develops near the end of prolonged downtrends.
The first bottom formed when AAVE dropped into the $113–$129 support zone, followed by a strong recovery attempt that pushed price toward the neckline resistance between $378 and $400. That rally ultimately faced rejection, but the latest sell-off has brought AAVE right back into the same support region.
What stands out this time is the buyer response. Price has once again stabilized within the $113–$129 zone, suggesting that bulls are actively defending this area and are not yet ready to give up control. The repeated defense of identical lows strengthens the case for this zone acting as a major accumulation region.
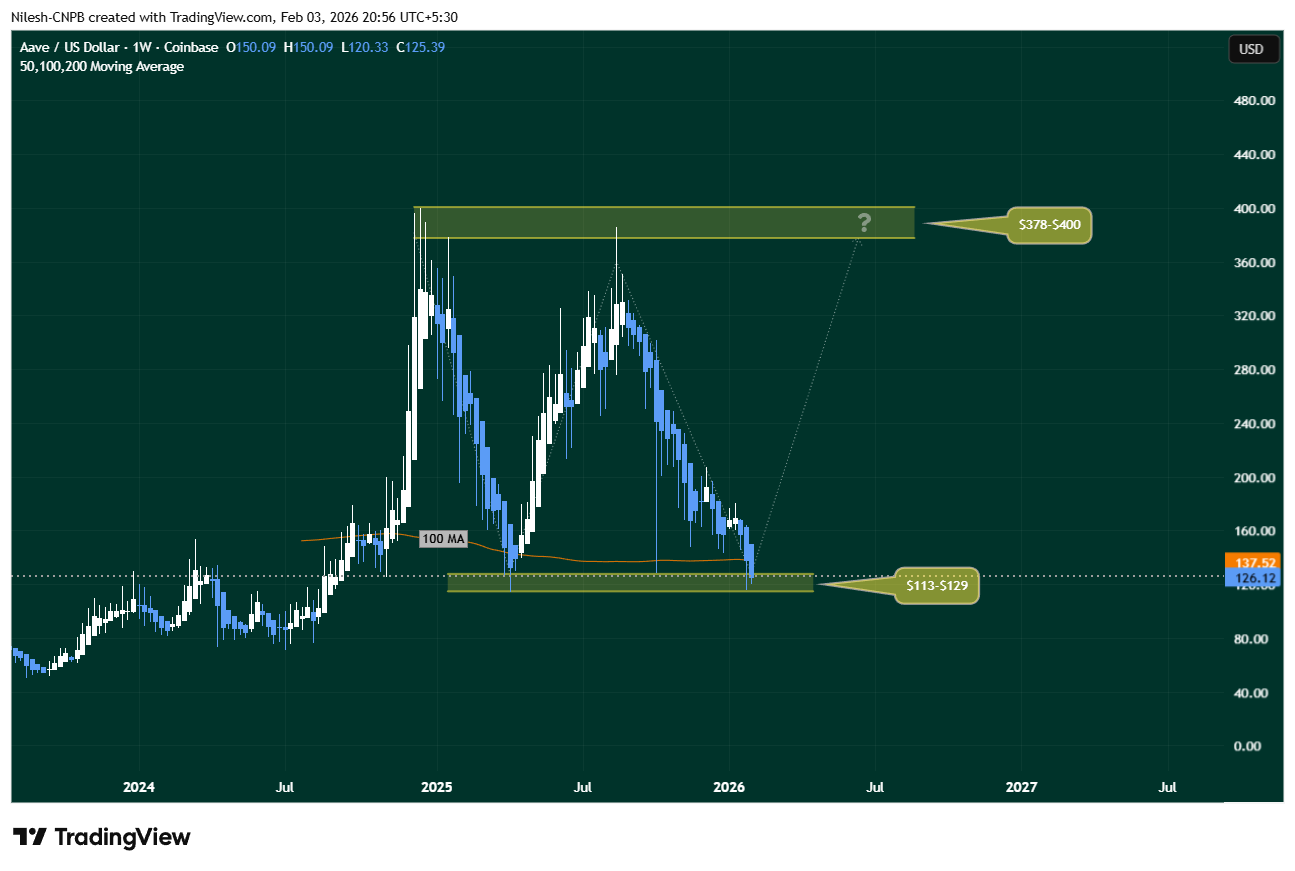
Aave ($AAVE) Weekly Chart/Coinsprobe (Source: Tradingview)
As long as AAVE continues to hold above this level, the broader double bottom structure remains technically valid.
What’s Next for AAVE?
For the bullish setup to gain traction, AAVE must hold the $113–$129 support zone and reclaim the 100-week moving average, currently sitting near $137.52. A sustained move above this level would signal improving momentum and mark an important shift in market structure.
If buyers manage to push price higher from here, the next major upside objective would be the neckline resistance at $378–$400. While that target may appear distant, a successful double bottom confirmation often leads to sharp recovery moves — especially if broader market conditions stabilize.
On the downside, the $113–$129 region remains the line in the sand. A decisive breakdown below this zone would invalidate the bullish setup and open the door to deeper downside risk.
Final Outlook
Despite recent weakness, AAVE’s technical structure remains constructive. The repeated defense of key support, the developing double bottom formation, and price hovering near the 100-week moving average suggest the token may be approaching a pivotal inflection point.
If accumulation continues and broader crypto sentiment improves, AAVE could be setting the stage for a meaningful recovery phase. Until then, all eyes remain on how price behaves around this critical support zone.
Disclaimer: The views and analysis presented in this article are for informational purposes only and reflect the author’s perspective, not financial advice. Technical patterns and indicators discussed are subject to market volatility and may or may not yield the anticipated results. Investors are advised to exercise caution, conduct independent research, and make decisions aligned with their individual risk tolerance.
About Author: Nilesh Hembade is the Founder and Lead Author of Coinsprobe, with over 5 years of experience in the cryptocurrency and blockchain industry. Since launching Coinsprobe in 2023, he has been providing daily, research-driven insights through in-depth market analysis, on-chain data, and technical research.
Disclaimer: The information on this page may come from third parties and does not represent the views or opinions of Gate. The content displayed on this page is for reference only and does not constitute any financial, investment, or legal advice. Gate does not guarantee the accuracy or completeness of the information and shall not be liable for any losses arising from the use of this information. Virtual asset investments carry high risks and are subject to significant price volatility. You may lose all of your invested principal. Please fully understand the relevant risks and make prudent decisions based on your own financial situation and risk tolerance. For details, please refer to
Disclaimer.
Related Articles
Should investors buy TAO right now or wait for the price to drop below $300?
Bittensor (TAO) remains resilient above the psychological level of $300, contrasting with the declines of Bitcoin and Ethereum. A confirmed bullish structure and rising demand for decentralized AI infrastructure support its strength, though a potential correction may offer buying opportunities.
TapChiBitcoin9m ago
PEPE Whales Move $20.7M—Is a Breakout or Breakdown Next?
PEPE whales withdrew $20.7M PEPE, reducing supply and easing sell pressure.
Price holds support, with compression building below key resistance level.
Rising OI and positive funding signal growing bullish momentum and breakout potential.
PepeCoin — PEPE, recently flashed a signal that
CryptoNewsLand37m ago
Bitcoin ETF ends seven consecutive days of gains, Bitcoin price pressure reappears.
Recently, after a continuous net inflow into the U.S. Bitcoin spot ETF for seven trading days, a significant outflow occurred, with a net outflow of $163.5 million on the 18th and another outflow of $51.9 million on the 19th, indicating a simultaneous weakening of market funds and prices. Bitcoin's price briefly fell below $70,000, highlighting that the fund flows from the ETF can no longer support its rebound, and the deteriorating macro environment is putting pressure on risk assets, leading to a noticeable contraction in investor preferences. The testing of the $70,000 level has become a barometer for short-term market sentiment.
区块客38m ago
The RWA Yield Infrastructure Trade
The essay highlights challenges in direct RWA token exposure, emphasizes the potential in leverage opportunities amid settlement delays, critiques Morpho's governance token structure, and presents Fluid as a more effective token model with stablecoin links.
CoinDesk54m ago
Gold plummets, "safe haven for funds" changes hands? JPMorgan: During wartime, "Bitcoin becomes the new darling of hedging."
JPMorgan Chase指出,在中东冲突中,比特币展现出强大的抗跌韧性,资金大规模涌入,交易活动活跃,而黄金和白银则面临资金外流。在高利率和强势美元的压力下,黄金价格下跌约15%。比特币凭借无国界特性成为避险选择,机构投资者也调整了布局,显示黄金流动性下降,而比特币流动性上升。
区块客1h ago
The cryptocurrency fear index has dropped to 9, with the market continuing to maintain "extreme fear."
The current cryptocurrency market fear and greed index has dropped to 9, indicating extreme fear in the market, well below yesterday's 12 and last month's average of 13. This index consolidates multiple indicators to assess market sentiment.
BlockBeatNews1h ago
