
Hyperliquid (HYPE) has delivered one of the strongest short-term moves in the market. Over the past week, the HYPE climbed roughly 45%.
On a broader view, price is up 42% over the last month, up 16% today, and trading around $36.08. Trading volume also expanded by about 40%, confirming that the move carried real participation.
This rally did not develop in isolation. It emerged as a protocol upgrade expanded Hyperliquid’s scope, on-chain supply tightened, and price structure finally broke free from consolidation.
The main trigger was the HIP-4 upgrade and the launch of “Outcomes” on test-net. This update takes Hyperliquid beyond perpetual futures into fully collateralized, range-based contracts. That expansion brings prediction-style and options-like markets into the protocol.
This changes the scale of the platform. Hyperliquid (HYPE) is no longer confined to a single trading vertical. Outcomes adds a new category of activity that attracts different users, strategies, and capital flows. As activity increases, fee generation increases with it.
The HYPE token mechanics magnified the response. A large portion of protocol revenue is routed into buybacks and burns.
As traders engage, circulating supply contracts. That dynamic tightened quickly after the HIP-4 announcement, prompting a rapid repricing as future fee flow and scarcity were reassessed together.
In addition, on-chain data added another layer to the move. Large holders accumulated as known heavy sellers completed distribution. That shift removed overhead supply at the same time demand began to accelerate.
This dynamic carries extra weight for the HYPE price due to the buyback system. With fewer large sellers active, protocol buybacks have a stronger impact on available supply.
New demand encounters less resistance, helping explain the speed of the advance once price cleared previous ceilings.
The result was a compressed supply environment paired with growing interest from both active traders and longer-term positioning tied to the protocol upgrade.
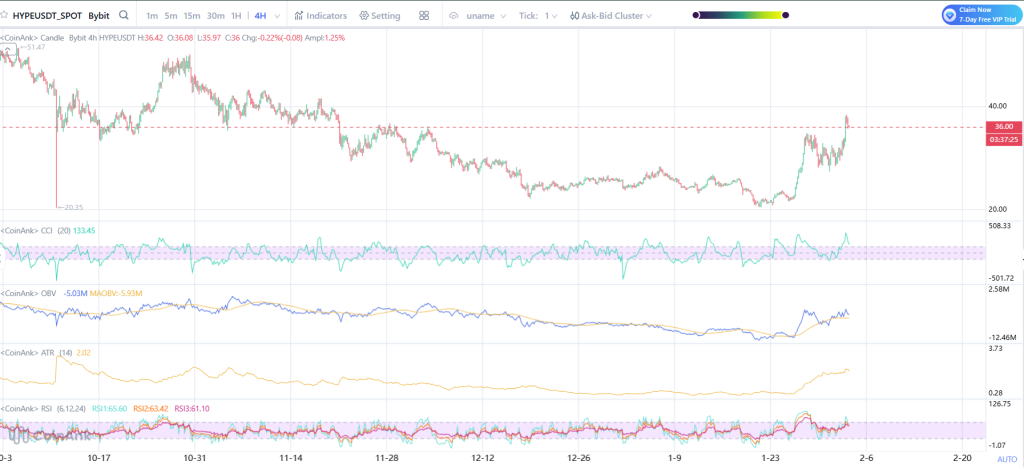
What the HYPE Chart Is Showing
The Hyperliquid price broke out after weeks of compression and held above former resistance, a typical feature of strong trend expansions. The move did not fade back into the range, which signals acceptance at higher levels.
Volume expanded alongside price, pointing to broad participation instead of thin liquidity. Momentum indicators remain constructive.
RSI sits in a healthy zone that often appears during sustained advances, not late-stage tops. MACD remains positive, showing trend direction still favors upside rather than stalling.
From a structure standpoint, the HYPE price now trades above levels that previously capped price. As long as those zones remain intact, the chart keeps a constructive posture, with the next upside area sitting just below the high-$30s region.
_****Solana (SOL) Fell 60%: Analyst Who Warned Early Explains What Comes Next**
Source: Coinank
However, this rally stands out because the broader crypto market stayed largely flat during the move. That relative strength shows the price action was driven internally, not by macro beta.
When an asset posts strong gains against a quiet backdrop, the narrative usually sits inside the project. In this case, it centers on product expansion, a stronger fee engine, and token mechanics aligned with rising activity.
The HYPE price 45% weekly advance reads as a re-rating phase where execution, structure, and supply dynamics are aligned at the same time.
Disclaimer: The information on this page may come from third parties and does not represent the views or opinions of Gate. The content displayed on this page is for reference only and does not constitute any financial, investment, or legal advice. Gate does not guarantee the accuracy or completeness of the information and shall not be liable for any losses arising from the use of this information. Virtual asset investments carry high risks and are subject to significant price volatility. You may lose all of your invested principal. Please fully understand the relevant risks and make prudent decisions based on your own financial situation and risk tolerance. For details, please refer to
Disclaimer.
Related Articles
Bitcoin Breaks Through $72,000: The Iran–Israel ceasefire boosts risk assets, with $427 million in short positions liquidated, but Polymarket shows disagreement on end-of-year outlook
Bitcoin broke through $72,000 on April 10, mainly due to a fragile ceasefire agreement between the U.S. and Iran that boosted market risk appetite, with funds flowing from safe-haven assets into Bitcoin. Increased institutional inflows and a rebound in Large Investors’ holdings are driving the price higher. Technical analysis shows that the main resistance lies in the $72,200 to $73,500 range. Despite a bullish outlook in the short term, there is still disagreement over forecasts for Bitcoin’s price by year-end, and the risk of a pullback also needs to be watched.
ChainNewsAbmedia1h ago
TAO (Bittensor) down 16.28% over the past 24 hours
Gate News message, on April 10, according to Gate market data, as of the time of publication, TAO (Bittensor) is trading at $269.80, down 16.28% over the past 24 hours. It reached a high of $341.10 and fell to a low of $248.60. The 24-hour trading volume is $14.71 million. The current market cap is approximately $2.59B.
Bittensor is an open-source protocol that supports a decentralized, blockchain-based machine learning network. Machine learning models train collaboratively and earn rewards in TAO based on the value of the information they provide to the collective. TAO also enables external access, allowing users to extract information from the network and adjust network activity according to their own needs.
---
Key recent news about TAO:
1️⃣ **
GateNews2h ago
The Strait of Hormuz is open! Iran demands tolls be paid in Bitcoin, and the Persian Gulf still has “big ships”
The Iranian government charges oil tankers a $1 per-barrel toll for passage through the Strait of Hormuz and requires payment in bitcoin to bypass U.S. sanctions. This move has caused extreme volatility in the cryptocurrency market, with bitcoin’s price surging, highlighting the importance of digital assets in geopolitics. Global shipping has been disrupted, Iran and the United States have taken differing positions in ceasefire talks, and financial markets have also roiled in response to this event.
CryptoCity2h ago
Bitcoin sees over 27k options contracts expire! Analyst: Bear market characteristics continue to dominate
According to Greeks.live data, April 10 saw BTC and ETH options expire. For BTC options, the number of contracts was 27,000, the Put/Call Ratio was 0.71, and the maximum pain point was $69,000. For ETH, it was 151,000 contracts, and the Put/Call Ratio was 0.77. The analysis indicates that market characteristics are skewed bearish, and falling implied volatility suggests the market expects less short-term volatility. Despite the recent rebound, internal momentum in the market has not formed, and no clear sentiment shift has been observed.
MarketWhisper2h ago
Fed Minutes Keep Bitcoin Traders Guessing as Iran Risk Clouds the Next Four Weeks
The Federal Reserve's recent minutes revealed mixed signals on potential rate changes, influenced by inflation and geopolitical tensions. Bitcoin's price is currently around $71,000, with analysts divided on its future amid these macroeconomic pressures, relying on factors like the Iran ceasefire and inflation trends.
CryptoNewsFlash4h ago
