
Key Takeaways
-
SAND price is showing early signs of stabilization after recent downside pressure.
-
Buyers appear to be defending a key support zone, hinting at a potential short-term rebound.
-
A breakout above nearby resistance could open the door for a stronger recovery move.
Gaming-focused crypto tokens are back in the spotlight after Axie Infinity (AXS) posted a sharp rally of over 16% in a single day and more than 246% over the past month, reigniting optimism around the gaming narrative. Riding this renewed momentum, Sandbox (SAND) has also stepped into focus, climbing nearly 45% as overall market sentiment turns constructive.
Beyond the recent price bounce, the technical structure on the chart is starting to tell a bigger story, hinting that SAND may be setting up for a bullish continuation move.
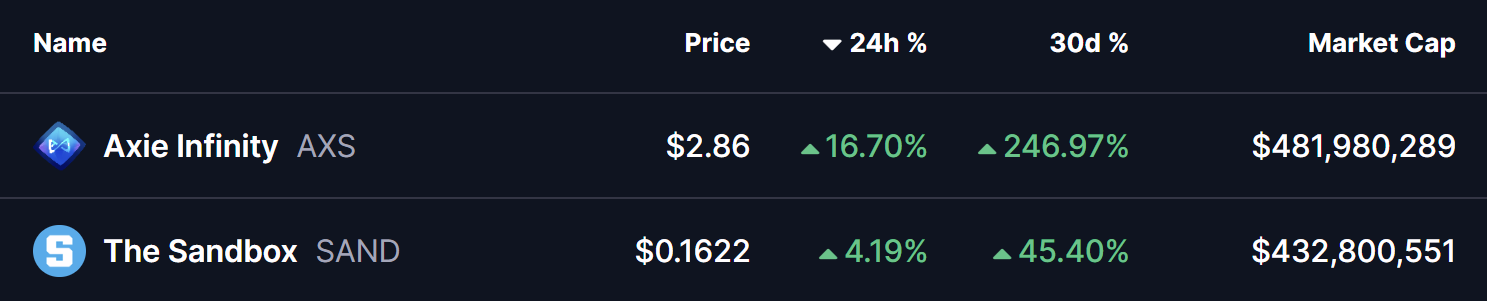
Source: Coinmarketcap
Descending Broadening Wedge Pattern in Play
On the daily timeframe, SAND is trading within a descending broadening wedge — a bullish reversal pattern that often develops during corrective phases before a trend shift. This structure reflects increasing volatility, with price gradually compressing while buyers quietly regain control.
During the latest pullback, SAND successfully retested the lower boundary of the wedge near the $0.11 zone, an area that has repeatedly acted as strong demand. Buyers stepped in aggressively at this level, triggering a rebound that pushed price toward $0.1711, placing SAND right near the wedge’s upper resistance trendline.
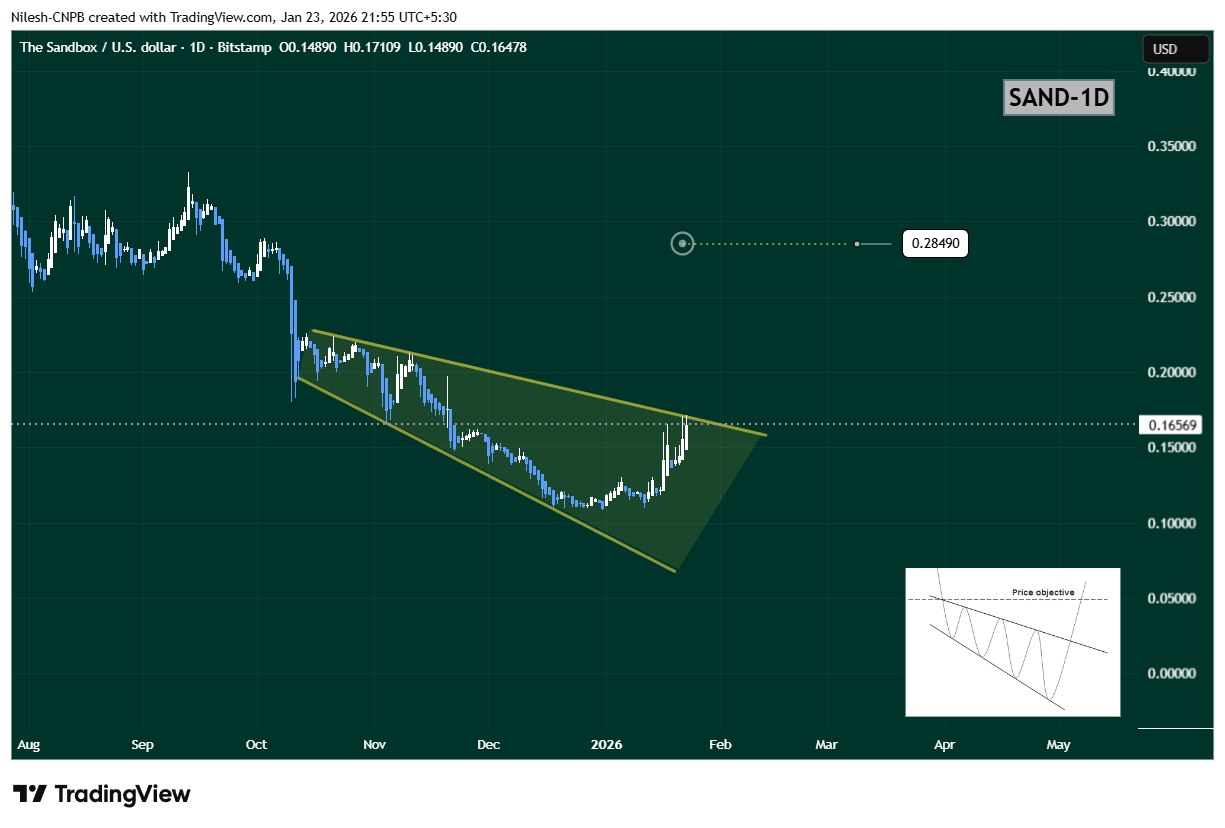
Sandbox (SAND) Daily Chart/Coinsprobe (Source: Tradingview)
The steady rise toward this upper boundary suggests growing bullish momentum and increasing breakout pressure.
What’s Next for SAND?
If buyers manage to push SAND above the upper wedge resistance near $0.1711, it would confirm a bullish breakout from the pattern. In that scenario, the chart opens the door for a move toward the $0.2849 target, which aligns with the measured move of the wedge and represents roughly 73% upside from current levels.
However, if price faces rejection at resistance, SAND could continue consolidating within the wedge structure. In that case, the $0.13–$0.14 region will act as an important short-term support zone to watch.
Bottom Line
SAND’s overall technical structure remains constructive. With a bullish descending broadening wedge in play, buyers defending key support, and gaming tokens gaining renewed attention, Sandbox appears to be positioning for a potential breakout. A confirmed move above resistance could mark the beginning of a stronger upside phase in the sessions ahead.
Disclaimer: The views and analysis presented in this article are for informational purposes only and reflect the author’s perspective, not financial advice. Technical patterns and indicators discussed are subject to market volatility and may or may not yield the anticipated results. Investors are advised to exercise caution, conduct independent research, and make decisions aligned with their individual risk tolerance.
About Author: Nilesh Hembade is the Founder and Lead Author of Coinsprobe, with over 5 years of experience in the cryptocurrency and blockchain industry. Since launching Coinsprobe in 2023, he has been providing daily, research-driven insights through in-depth market analysis, on-chain data, and technical research.
Disclaimer: The information on this page may come from third parties and does not represent the views or opinions of Gate. The content displayed on this page is for reference only and does not constitute any financial, investment, or legal advice. Gate does not guarantee the accuracy or completeness of the information and shall not be liable for any losses arising from the use of this information. Virtual asset investments carry high risks and are subject to significant price volatility. You may lose all of your invested principal. Please fully understand the relevant risks and make prudent decisions based on your own financial situation and risk tolerance. For details, please refer to
Disclaimer.
Related Articles
Bitcoin drops toward $68,000 as demand weakens and whales sell
Bitcoin BTC$68,767.57 slid toward $68,000 on Tuesday, with traditional markets closed in Hong Kong for a long weekend, as repeated failures near $70,000 left the bitcoin market vulnerable to a break lower.
The drop came after another failed push above $70,000, with prices slipping quickly once
CoinDesk12m ago
Bitcoin is hovering around the $68,000 threshold, and the risk of further downside is increasing as whales sell and demand remains weak.
Gate News: Bitcoin’s price has fallen to around $68,000. It had repeatedly failed to break through the $70,000 level, and market momentum has clearly weakened. The current price is still within the $65,000 to $73,000 trading range, but the risk of testing the lower end of the range is rising.
GateNews16m ago
Santiment Alert: BTC profit-loss ratio hits 2.95, the top signal is approaching
Based on Santiment data, Bitcoin’s profit-to-loss trade ratio has reached 2.95:1, nearing the historical alert level of 3.0, which may signal a short-term price top. A high profit-to-loss ratio also reflects optimistic market sentiment, but it can also build up selling pressure. Historical cases show that a profit-to-loss ratio near 3.0 does not necessarily lead to a pullback; the market needs to combine multiple indicators for a comprehensive analysis.
MarketWhisper32m ago
Freedom of Money surges 50%, as CZ’s new book drives a wave of same-name meme coin hype
Meme coin Freedom of Money saw a major surge of 50% on April 7, with its market value exceeding $22 million, driven by market sentiment after CZ announced that a new book is set to be released. However, the coin has no official connection to CZ or Binance, and its rally is purely a market-sentiment hype; investors should be cautious of the risks stemming from a lack of fundamental support.
MarketWhisper39m ago
The crypto market is broadly down; only the RWA sector is up slightly, at 0.42%.
On April 7, the crypto market fell broadly, with only the RWA sector up slightly by 0.42%. Major coins Bitcoin and Ethereum declined by 0.34% and 0.43%, respectively. Other sectors generally contracted, but some projects such as Creditcoin and Centrifuge rose against the trend.
GateNews1h ago
Tom Lee has released a post-war asset ranking, with Ethereum outperforming the broader market to win second place.
Tom Lee said on CNBC that since the start of geopolitical conflicts, Ethereum has outperformed the broader market, posting a gain of more than 8% and ranking second globally. Wartime fiscal spending is expected to grow, which will provide support for the market. BitMine recently holds more than 4.8 million Ether—equivalent to more than 4.8 million Ethereum—showing bullish confidence and strategy.
MarketWhisper2h ago
