
The Kaspa (KAS) is trading around the $0.041 area as the new week begins, with price still struggling to regain momentum after a long corrective phase.
On the development side, Kaspa has continued to expand its real-world narrative. A new non-profit industrial initiative was launched last week to push Kaspa into regulated finance and supply chain use cases.
At the same time, analysts have pointed out that the KAS price needs to clear the $0.046 level to confirm a proper recovery.
The recent launch of K-Social has also added a utility layer to the ecosystem, showing Kaspa’s focus on censorship-resistant communication. Even with these developments, the KAS price remains under pressure on the chart.
- What the KAS chart is showing
- What market indicators are saying
- KAS price short-term outlook for this week
What the KAS chart is showing
On the 4H chart, Kaspa is clearly in a broader downtrend that began after the sharp sell-off in mid-October. That drop changed the structure of the market, and price has not managed to reclaim key resistance levels since.
After that major breakdown, the KAS price attempted a recovery toward the $0.060 area but failed to hold it. Since then, price has been moving lower in a controlled and steady manner. Over the past weeks, KAS has been moving sideways between $0.040 and $0.046.
Right now, price is sitting near the lower end of that range. Sellers have not pushed it much lower, but buyers are also not stepping in with strength yet.
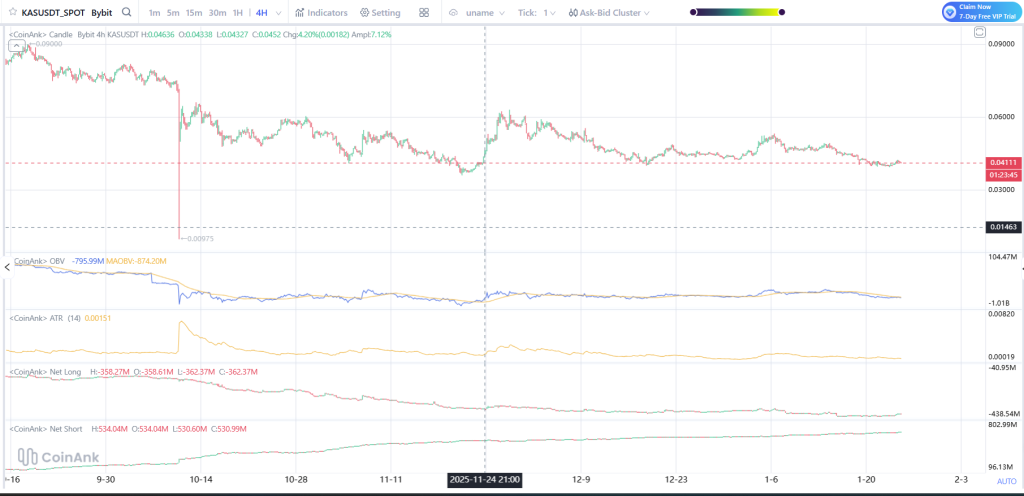
Source: Coinank
What market indicators are saying
OBV is still low, showing that strong buying has not returned yet. It has flattened lately, which means selling is slowing down, but real accumulation is still missing.
ATR has dropped since the big move in October, which tells us volatility is fading. This often happens before price makes its next larger move.
The position data shows that even more traders are taking a short position, and the long position is declining further, which is a confirmation that the overall sentiment of the market is bearish, even though the price is no longer dropping significantly.
Both of these indicate that the market is settling down, but it is not yet giving a clue of reversal.
_****SUI Moves Beyond the “Solana Killer” Label With a Privacy-First Shift**
KAS price short-term outlook for this week
Kaspa is supported in its range of $0.040 to $0.039. So long as it sustains, we consider it stable in terms of price.
If the KAS price rises and sustains its position past $0.046, then the resistance levels are $0.050 and then $0.055. Trespassing $0.055 will be the first clear sign for investors that prices are trying to move higher.
If KAS declines below $0.039, subsequent support levels are at around $0.035 and $0.030.
For the Kaspa price in the upcoming week, it is could range from $0.040 to $0.046. A rise above these values is expected to favor buyers, while a fall below $0.039 is expected to favor sellers.
Disclaimer: The information on this page may come from third parties and does not represent the views or opinions of Gate. The content displayed on this page is for reference only and does not constitute any financial, investment, or legal advice. Gate does not guarantee the accuracy or completeness of the information and shall not be liable for any losses arising from the use of this information. Virtual asset investments carry high risks and are subject to significant price volatility. You may lose all of your invested principal. Please fully understand the relevant risks and make prudent decisions based on your own financial situation and risk tolerance. For details, please refer to
Disclaimer.
Related Articles
The Crypto Fear and Greed Index rose to 17 today, and the market remains in a state of extreme fear
Gate News message: On April 8, according to Alternative.me data, the crypto Fear and Greed Index rose to 17 today, up from 11 yesterday (April 7), but the market overall is still in a state of “extreme fear.”
GateNews8m ago
Bitcoin reclaims $72K after US, Iran agree to 2-week ceasefire
Bitcoin surged past $72,000 after a two-week ceasefire between the US and Iran was announced. Traders often react positively to eased geopolitical tensions, despite overall market fear.
Cointelegraph9m ago
BTC drops 1.03% in 15 minutes: tighter macro liquidity and derivatives synchronized to amplify sell-off pressure
From 23:30 to 23:45 (UTC) on 2026-04-07, the BTC price rapidly fell within 15 minutes, with a return of -1.03%. The price range was 71,905.7 to 72,760.5 USDT, and the amplitude was 1.17%. Market attention remained high; intraday volatility significantly increased. Trading volumes across major platforms briefly surged, indicating that selling pressure and risk-avoidance sentiment had permeated mainstream cryptocurrencies.
The main drivers of this deviation were the continued tightening of macro liquidity under the Fed’s hawkish signals and a concentrated adjustment in the BTC derivatives market. The Fed’s interest rate in March 2026
GateNews1h ago
Peter Schiff Challenges Michael Saylor as Bitcoin Debate Heats Up
Peter Schiff and Michael Saylor recently debated Bitcoin's performance, with Schiff arguing it underperformed gold and equities over five years, while Saylor highlighted shorter-term gains. Their dispute illustrates the complexity of data selection in assessing investment viability.
CryptoFrontNews1h ago
BTC 15-minute surge of 1.07%: On-chain activity spikes and ETF fund inflows synchronize to drive the move
2026-04-07 22:45 to 2026-04-07 23:00 (UTC), the BTC price recorded a +1.07% return. The price range was 70,733.5 to 71,518.9 USDT, with a 1.11% amplitude. Short-term volatility intensified, drawing strong market attention. On-chain data shows the number of active addresses rose to 38,971, up 5.2% from the previous hour. The total number of addresses added approximately 252,780 within an hour; network activity and new user growth increased significantly, becoming the incremental market momentum behind the unusual move. Spot trading volume reached 11
GateNews1h ago
ETH 15-minute increase of 0.64%: Short-term capital inflows and sentiment shifts drive price fluctuations
2026-04-07 22:00 to 22:15 (UTC), the ETH price ranged between 2145.02 and 2165.83 USDT, and the 15-minute candlestick return reached +0.64%, with a trading range (amplitude) of 0.97%. Market volatility increased and attention rose, indicating short-term activity driven by rapid capital flows.
The main driving force behind this unusual move is that, in the short term, some funds flowed into ETH. Investors are focusing on ETH mainnet assets, and buying interest increased, pushing spot prices higher. At the same time, DeFi and stablecoin-related trading remained active, boosting on-chain liquidity and helping to support a
GateNews2h ago
