
Date: 11 Jan 2026, 06:20 PM GMT
Key Highlights
-
Pump.fun (PUMP) posts over 6% intraday gains as broader crypto market sentiment improves.
-
The 4H chart shows a bearish ABCD harmonic pattern, with the bullish CD leg currently in play.
-
Price rebounded strongly from the 100-period moving average, reinforcing trend strength.
-
The pattern projects a potential upside move toward the $0.00296 region.
-
Holding above the $0.00225 support zone remains critical to sustain the bullish structure
The broader cryptocurrency market has regained modest upward momentum today, with both Bitcoin (BTC) and Ethereum (ETH) returning to positive territory. This improvement in sentiment has helped stabilize the altcoin space, and Pump.fun (PUMP) is emerging as one of the stronger performers, posting over a 6% intraday gain.
Beyond the short-term price bounce, PUMP’s chart structure is beginning to show a technically constructive setup that suggests additional upside could be developing.
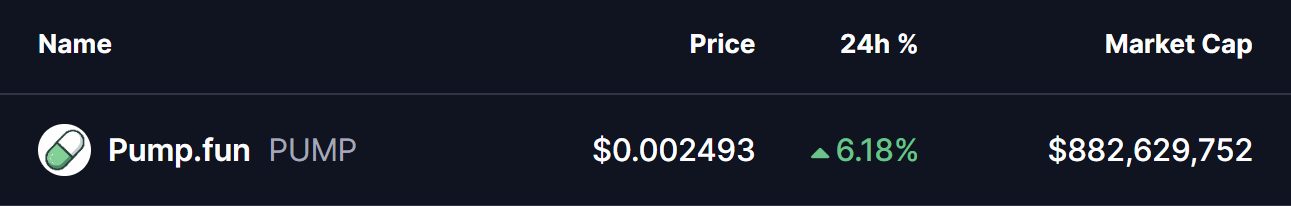
Source: Coinmarketcap
Harmonic Pattern Signals Bullish Continuation
On the 4-hour timeframe, PUMP appears to be forming a bearish ABCD harmonic pattern — a structure that often develops during the later stages of an uptrend. While this pattern can eventually signal a reversal once the final leg completes, the CD leg itself is typically driven by strong bullish momentum, often producing notable upside before any exhaustion sets in.
As illustrated on the chart, the pattern initiated at Point A near $0.00179, followed by a sharp impulsive rally into Point B around $0.00272. Price then entered a corrective phase, pulling back toward Point C near $0.00203.
Importantly, this retracement aligned closely with the 100-period moving average, where buyers stepped in decisively. The swift reaction from this zone reinforced the strength of the underlying trend and helped preserve the harmonic structure.
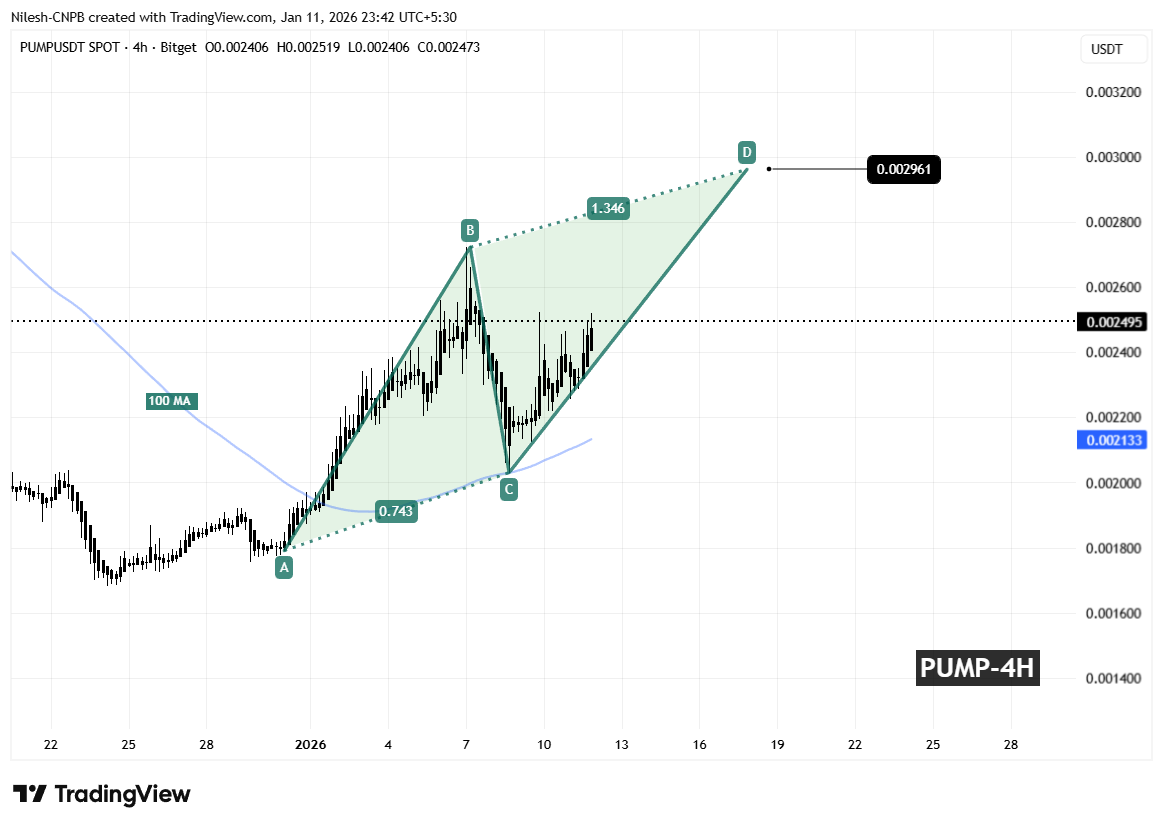
Pump.fun (PUMP) 4H Chart/Coinsprobe (Source: Tradingview)
Since bouncing from Point C, PUMP has resumed its advance and is now trading back around the $0.0025 area, signaling that the CD leg is actively unfolding.
What Could Come Next for PUMP?
If the ABCD pattern continues to play out as projected, the CD leg could extend toward the 1.346 Fibonacci projection of the BC segment. This places the Potential Reversal Zone (PRZ) near $0.00296, which sits roughly 18% above current price levels.
This zone is typically where traders begin to watch for signs of short-term exhaustion or profit-taking, as harmonic patterns often complete around these extensions. Until then, momentum favors the bulls, provided the structure remains intact.
From a risk perspective, holding above the $0.00225 support region will be crucial. A decisive breakdown below this level would weaken the harmonic setup and increase the likelihood of renewed downside pressure.
For now, PUMP’s price action remains technically constructive, with buyers defending key levels and momentum pointing toward a possible continuation higher before any broader consolidation or reversal attempt emerges.
Frequently Asked Questions (FAQ)
What is driving Pump.fun (PUMP) price higher today?
PUMP is benefiting from improving overall market sentiment and a bullish harmonic structure on the 4-hour chart, supported by strong buying interest near the 100-period moving average.
What pattern is forming on the PUMP chart?
The chart indicates a bearish ABCD harmonic pattern. While such patterns can lead to reversals at completion, the CD leg often produces strong bullish momentum before that point.
What is the upside target for Pump.fun (PUMP)?
If the CD leg continues, the projected upside target lies near the $0.00296 level, which aligns with the 1.346 Fibonacci extension.
Is Pump.fun (PUMP) still bullish in the short term?
As long as price remains above key support and momentum holds, the short-term outlook remains cautiously bullish.
Disclaimer: The views and analysis presented in this article are for informational purposes only and reflect the author’s perspective, not financial advice. Technical patterns and indicators discussed are subject to market volatility and may or may not yield the anticipated results. Investors are advised to exercise caution, conduct independent research, and make decisions aligned with their individual risk tolerance.
About Author: Nilesh Hembade is the Founder and Lead Author of Coinsprobe, with over 5 years of experience in the cryptocurrency and blockchain industry. Since launching Coinsprobe in 2023, he has been providing daily, research-driven insights through in-depth market analysis, on-chain data, and technical research.
Disclaimer: The information on this page may come from third parties and does not represent the views or opinions of Gate. The content displayed on this page is for reference only and does not constitute any financial, investment, or legal advice. Gate does not guarantee the accuracy or completeness of the information and shall not be liable for any losses arising from the use of this information. Virtual asset investments carry high risks and are subject to significant price volatility. You may lose all of your invested principal. Please fully understand the relevant risks and make prudent decisions based on your own financial situation and risk tolerance. For details, please refer to
Disclaimer.
Related Articles
Hyperliquid is experiencing strong growth from 2 main areas: What does this mean for the demand for HYPE?
Recent on-chain data shows a clear shift in how demand is forming around Hyperliquid (HYPE). A "whale" deposited 4 million USDC, then purchased approximately 56,208 HYPE for a total value of about 2.1 million USD at a price of 38.21 USD.
Notably, the accumulation process did not stop at a single transaction.
TapChiBitcoin2m ago
Oil prices exceed $100! Trump calls for negotiations nearing the end "to seize Iranian oil," analysts warn: Bitcoin may dip to a bottom of $46,000.
Oil prices broke above $100 on Monday due to a sharp rise in geopolitical risks, especially Trump's tough rhetoric towards Iran. Crypto analyst Willy Woo warned that Bitcoin's on-chain capital outflow may fall to between $46,000 and $54,000. If the global macro market structure breaks down, the crypto market faces a deeper bear market risk. Trump's negotiation moves and the strategic importance of Hark Island have heightened market uncertainty and affected global oil prices and asset liquidity.
動區BlockTempo4m ago
Trump TACO trading encounters bottlenecks, Iranian speaker teaches traders reverse operations.
Iranian Parliament Speaker Ghalibaf questioned Trump's trading strategy TACO and suggested taking a reverse approach. The article analyzes the reasons for TACO's failure in the Iranian crisis, including the different nature of the opponents, the absence of the Supreme Leader, and the rising geopolitical risks, which have led to a decline in market confidence. Additionally, Ghalibaf also threatened that institutions purchasing U.S. Treasury bonds are "legitimate military targets," posing a new threat to the bond market.
MarketWhisper23m ago
A Canadian billionaire mocks Tom Lee's latest forecast for the crypto market.
Frank Giustra mocked Wall Street strategist Tom Lee's optimistic forecast about the end of "crypto winter." While Lee sees market reversal signals and potential bullish trends, Giustra remains skeptical, emphasizing gold as a safer investment amid high-risk crypto.
TapChiBitcoin30m ago
The MVRV of short-term Bitcoin holders has dropped to 0.77, with an average unrealized loss of nearly 30%.
The current price of Bitcoin is in the range of $65,000 to $70,000, which is significantly different from the average cost of short-term holders at $85,900, leading most investors to incur losses. The MVRV metric has dropped to 0.77, indicating that the short-term holding group is under pressure.
GateNews35m ago
Why Is Bitcoin Down Today? The U.S. Extends the Iran War, ETF Outflows Accelerate as Miners Surrender
Bitcoin has fallen below $67,000, with a weekly decline of about 3%, influenced by U.S. military actions against Iran, along with outflows from spot Bitcoin ETFs and the return of interest rate hike expectations in pricing, leading to a fearful market sentiment. Increased miner sell-offs have been noted, but it is pointed out that demand-side expansion confirmation is needed to maintain a bullish outlook.
MarketWhisper1h ago
