Hedera (HBAR) is currently fluctuating around the 0.127 USD level during Wednesday’s trading session, approaching a key resistance zone. If the price convincingly breaks through this level, the market could witness a new upward momentum in the near future. Notably, demand from institutional investors continues to increase, as spot HBAR ETF funds have recorded three consecutive days of net inflows this week. Simultaneously, positive signals from on-chain data and derivatives markets further reinforce the expectation that HBAR is on the verge of extending its bullish trend.
Institutional demand for HBAR continues to grow
Demand from institutional investors for Hedera has shown a clear increase this week. According to data from SoSoValue, spot Hedera ETF funds attracted $817,770 in capital on Tuesday, marking the third consecutive day of positive inflows since last week. This development reflects strong investor confidence and opens up the possibility that if capital inflows continue and increase, HBAR could extend its current upward trend.
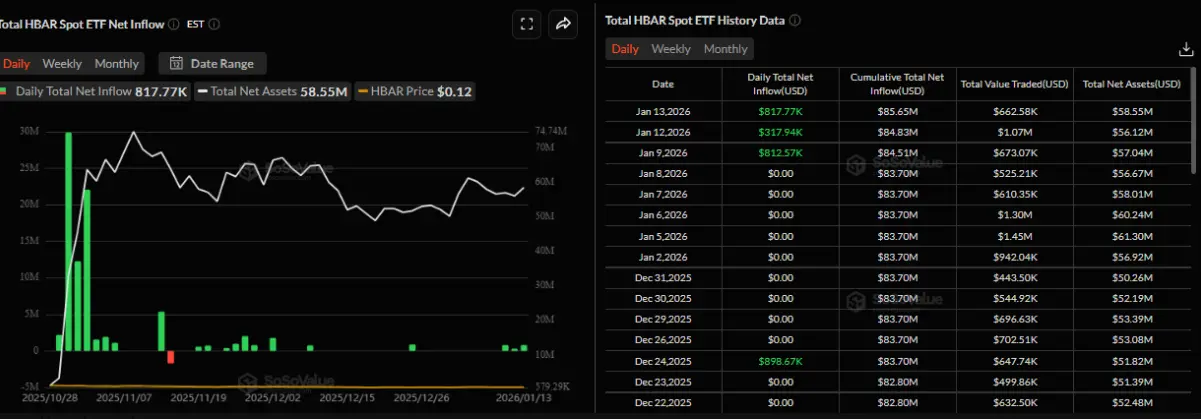 Total net inflow chart into HBAR spot ETFs## Positive on-chain and derivatives indicators
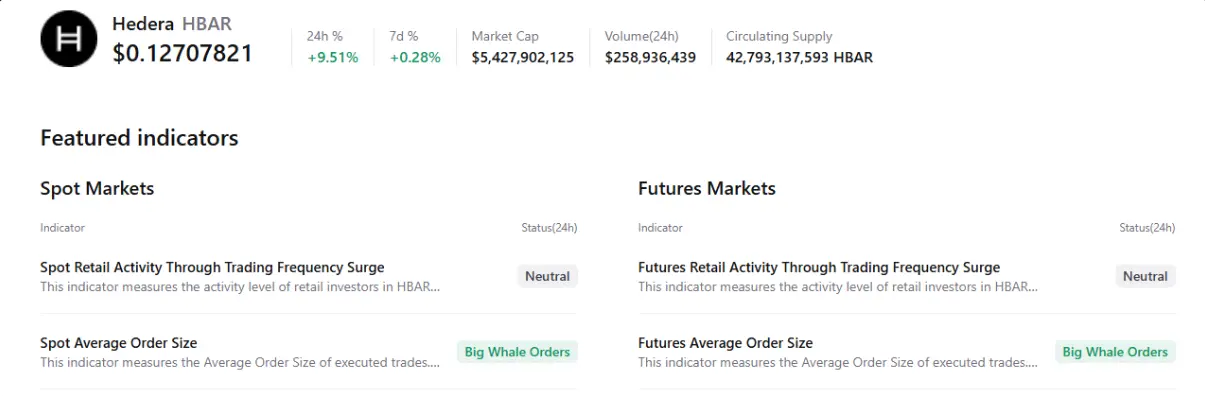
Data from the CryptoQuant chart below further strengthen HBAR’s positive outlook, as both the spot market and futures contracts show large buy orders from whales. This movement is often seen as an early signal that a new bullish phase may be forming in the near future.
In the derivatives market, bullish sentiment is also becoming more evident. According to Coinglass, the long/short ratio of HBAR reached 1.06 on Wednesday — the highest in over a month. Maintaining this ratio above 1 indicates that most traders are leaning towards a bullish scenario, reflecting growing confidence in Hedera’s continued upward movement.
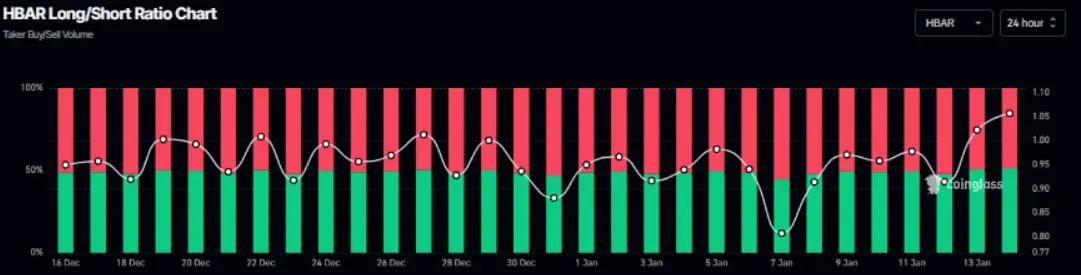 Hedera long/short ratio chart | Source: Coinglass## Hedera Price Forecast: HBAR could extend its rally if it closes above the 50-day EMA
Hedera (HBAR) is currently moving within a descending wedge pattern formed since late July, with highs and lows gradually narrowing. Notably, HBAR surged over 6% during Tuesday’s trading session, indicating renewed buying interest. As of Wednesday, the price is approaching the 50-day exponential moving average (EMA) around the 0.127 USD mark — an important technical level.
In a positive scenario, if HBAR can close firmly above the 50-day EMA, the recovery momentum is likely to continue, pushing the price toward the upper trendline of the wedge pattern, around 0.152 USD.
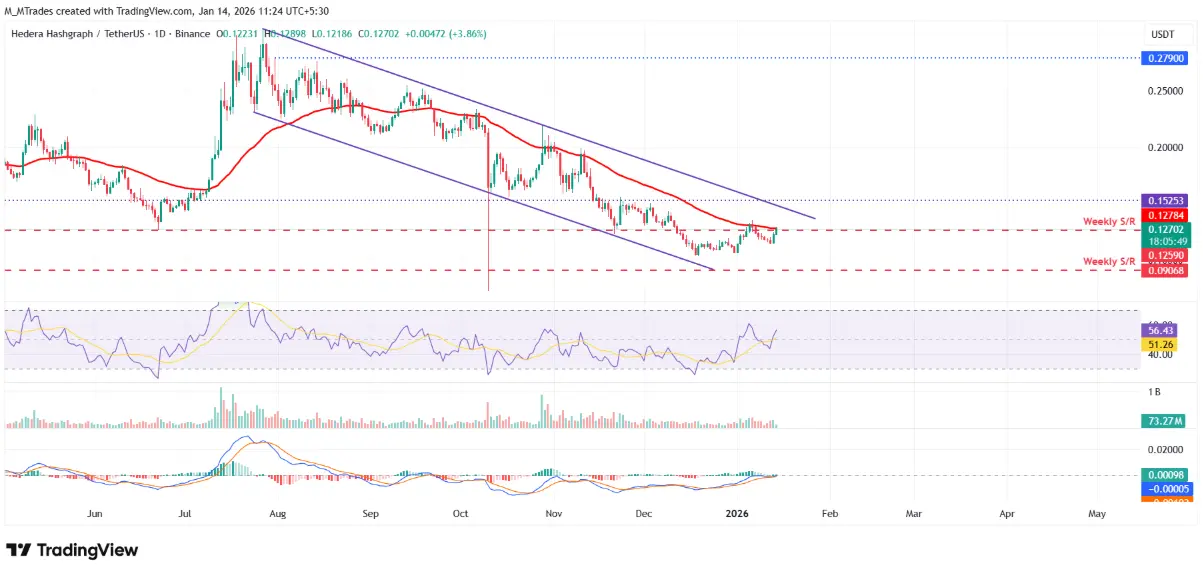 Daily HBAR/USDT chart | Source: TradingView Technical indicators also support a bullish outlook. The daily RSI stands at 56, rising above the neutral 50 level, indicating increasing buying momentum. Meanwhile, the MACD continues to show a bullish crossover, further strengthening the optimistic scenario.
However, the risk of a correction should not be overlooked. If selling pressure increases, HBAR could reverse and decline toward the weekly support zone around 0.090 USD, where demand is expected to re-emerge.
SN_Nour
Disclaimer: The information on this page may come from third parties and does not represent the views or opinions of Gate. The content displayed on this page is for reference only and does not constitute any financial, investment, or legal advice. Gate does not guarantee the accuracy or completeness of the information and shall not be liable for any losses arising from the use of this information. Virtual asset investments carry high risks and are subject to significant price volatility. You may lose all of your invested principal. Please fully understand the relevant risks and make prudent decisions based on your own financial situation and risk tolerance. For details, please refer to
Disclaimer.
Related Articles
Miners collectively transform into AI: Mining costs have inverted by nearly $20,000, selling Bitcoin to raise $7 billion for a shift in computing power.
Bitcoin mining is undergoing a structural transformation, with average mining costs for mining companies expected to reach $80,000 by the end of 2025, while the price of Bitcoin is only around $70,000. Mining companies are increasingly turning to artificial intelligence and high-performance computing, with total related contracts exceeding $70 billion. The funding for this transformation mainly comes from leveraged financing and the sale of Bitcoin reserves. Although there is a significant divergence in the valuations of mining companies, whether the price of Bitcoin can rebound to $100,000 will impact the future development of the mining industry.
BlockBeatNews29m ago
Citigroup slashes Bitcoin and Ethereum 12-month price targets, stating that stalled U.S. crypto legislation weakens upward catalysts.
Citigroup lowers its 12-month target prices for Bitcoin and Ethereum, indicating that its medium-term outlook for the crypto market has turned cautious, mainly because progress on U.S. crypto-asset legislation has been slow. Its Bitcoin target is reduced from $143,000 to $112,000, and its Ethereum target is lowered to $3,175. Although there is still room for upside in the future, the lack of new policy catalysts means prices could trade within a range in the short term. Citigroup is even more cautious in its assessment of Ethereum, saying it is more heavily influenced by on-chain activity.
区块客3h ago
The cryptocurrency fear and greed index has dropped to 12, indicating that the market is in a state of extreme fear.
Gate News report, on March 28, according to data from Alternative.me, the cryptocurrency fear and greed index has fallen to 12 today, indicating a state of "extreme fear" in the market. Yesterday, the index was at 13, also indicating "extreme fear."
GateNews3h ago
