
As the new year 2026 begins, the broader cryptocurrency market has shown modest strength over the past few hours, with both Bitcoin (BTC) and Ethereum (ETH) turning slightly green. This improvement in sentiment has started to spill over into the altcoin market as well, with several tokens attempting to build upward momentum — including Render (RENDER).
RENDER is currently up around 4% on the day, but the more compelling development lies beneath the surface. On lower timeframes, price action is beginning to highlight a constructive bullish structure that could soon pave the way for a meaningful breakout if confirmed.
Source: Coinmarketcap
Ascending Triangle Structure Takes Shape
On the 4-hour chart, RENDER appears to be forming a textbook ascending triangle, characterized by a sequence of higher lows pressing steadily against a well-defined horizontal resistance zone. This structure is widely viewed as a bullish continuation pattern, particularly when it develops after a period of consolidation and shows signs of accumulation.
RENDER recently faced rejection near the $1.36 neckline resistance, which pushed price back toward its rising support trendline around the $1.28 region. However, each pullback has been met with strong buying interest, keeping the pattern intact and preventing any deeper breakdown. This behavior suggests that sellers are gradually losing control as buyers continue to step in at higher levels.
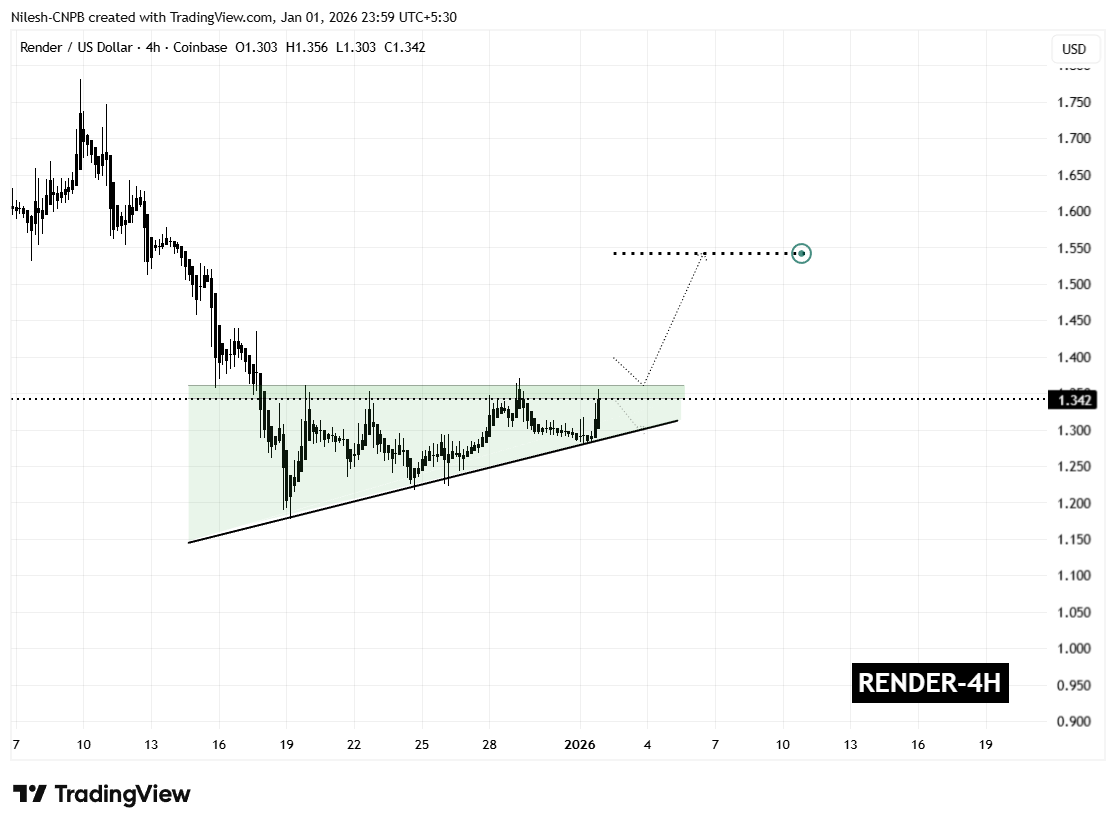
Render (RENDER) 4H Chart/Coinsprobe (Source: Tradingview)
The latest rebound has carried RENDER back toward the upper boundary of the pattern, reinforcing the idea that demand remains firm. Rather than signaling weakness, this price action points to healthy consolidation as the market tightens ahead of a potential breakout.
What’s Next for RENDER?
From here, RENDER appears to be preparing for another test of the $1.36 resistance zone. A confirmed breakout and sustained close above this level, ideally followed by a successful retest as support, would validate the ascending triangle structure and likely trigger a bullish expansion phase.
Based on the measured move of the pattern, the technical upside projection points toward the $1.54 region. This target represents a potential upside of roughly 14% from current levels and also aligns with previous price structure, strengthening the bullish case.
That said, caution remains warranted. A failure to break above resistance could result in a pullback toward the rising support trendline. As long as that trendline continues to hold, the broader bullish structure would remain intact. A decisive breakdown below support, however, would invalidate the pattern and delay any breakout scenario.
For now, the combination of improving market sentiment, persistent buying pressure, and a tightening ascending triangle structure suggests that Render is approaching a critical decision point — one that could define its next significant move as 2026 gets underway.
Disclaimer: The views and analysis presented in this article are for informational purposes only and reflect the author’s perspective, not financial advice. Technical patterns and indicators discussed are subject to market volatility and may or may not yield the anticipated results. Investors are advised to exercise caution, conduct independent research, and make decisions aligned with their individual risk tolerance.
About Author: Nilesh Hembade is the Founder and Lead Author of Coinsprobe, with over 5 years of experience in the cryptocurrency and blockchain industry. Since launching Coinsprobe in 2023, he has been providing daily, research-driven insights through in-depth market analysis, on-chain data, and technical research.
Disclaimer: The information on this page may come from third parties and does not represent the views or opinions of Gate. The content displayed on this page is for reference only and does not constitute any financial, investment, or legal advice. Gate does not guarantee the accuracy or completeness of the information and shall not be liable for any losses arising from the use of this information. Virtual asset investments carry high risks and are subject to significant price volatility. You may lose all of your invested principal. Please fully understand the relevant risks and make prudent decisions based on your own financial situation and risk tolerance. For details, please refer to
Disclaimer.
Related Articles
Analyst: TD Sequential Flashes Buy Signals for These 2 Popular Altcoins
Two of the largest and most popular altcoins might be prone to big upward moves ahead, at least according to Ali Martinez, who outlined the TD Sequential as the indicator suggesting these breakouts.
Namely, those are DOGE, which continues to struggle well below $0.10, and ADA, which has fallen
CryptoPotato47m ago
ETH breaks below a key support level, forming a bear flag pattern
Ethereum has currently broken below a key support level, presenting a bearish flag pattern, indicating a potential continuation of the downward trend. Trading volume is sluggish, market participation is insufficient, and there is a continued net outflow from ETFs. The minting of USDC has slowed, liquidity recovery is unstable, and time is needed to repair demand.
GateNews57m ago
XRP Today News: CLARITY Bill Blocked, Bull and Bear Battle at $1.30
XRP fell 0.81% over the past 24 hours, trading at about $1.33, indicating insufficient bullish momentum. The 《CLARITY Act》 has again been stalled due to regulatory disputes over stablecoin yield rates, with the legislative process stalled for more than a year. XRP’s technical analysis shows downside pressure, with a key support level at $1.30 and a resistance level at $1.38. In the short term, market sentiment remains cautious due to regulatory uncertainty.
MarketWhisper1h ago
Iranian Parliament Speaker Warns Market Manipulation Using The US-Iran Conflict
Speaker MB Ghalibaf of the Iranian Parliament warned investors of market manipulation tied to the US-Iran war, advising them to trade against misleading narratives. His comments sparked mixed reactions online, highlighting the broader impact of geopolitical tensions on markets.
Blockzeit2h ago
Stablecoin market capitalization surpasses 310 billion, with Ethereum's second position being approached by USDT.
Ethereum (ETH) is currently facing structural challenges from the Tether stablecoin USDT, which has seen its market cap grow by 622.50% over five years, greatly surpassing ETH's 11.75%. The stablecoin market size has increased from $5 billion to $310 billion, indicating a rise in safe-haven demand. ETH is also affected by geopolitical and monetary policy factors, with institutional funds withdrawing, leading to a stagnant market cap growth. Technical analysis suggests that ETH could drop to $1,250, further widening the market cap gap with USDT.
MarketWhisper2h ago
Bitcoin Stalls Near $67K As Analyst Warns Market Could Revisit Recent Lows
Crypto analyst Michaël van de Poppe’s latest comment on Bitcoin landed at a moment when the market is already struggling to find direction. In his post, he said the trend remains unchanged, described the session as one of the “most boring” of the week, and argued that if Bitcoin cannot push back
BlockChainReporter2h ago
