
Date: Mon, Dec 29, 2025 | 04:10 PM GMT
The broader cryptocurrency market has seen a short-term pullback over the past few hours, with Bitcoin (BTC) slipping below the $87K level after briefly trading above $90K. This retracement has spilled over into major altcoins, including Avalanche (AVAX), which is also experiencing mild selling pressure.
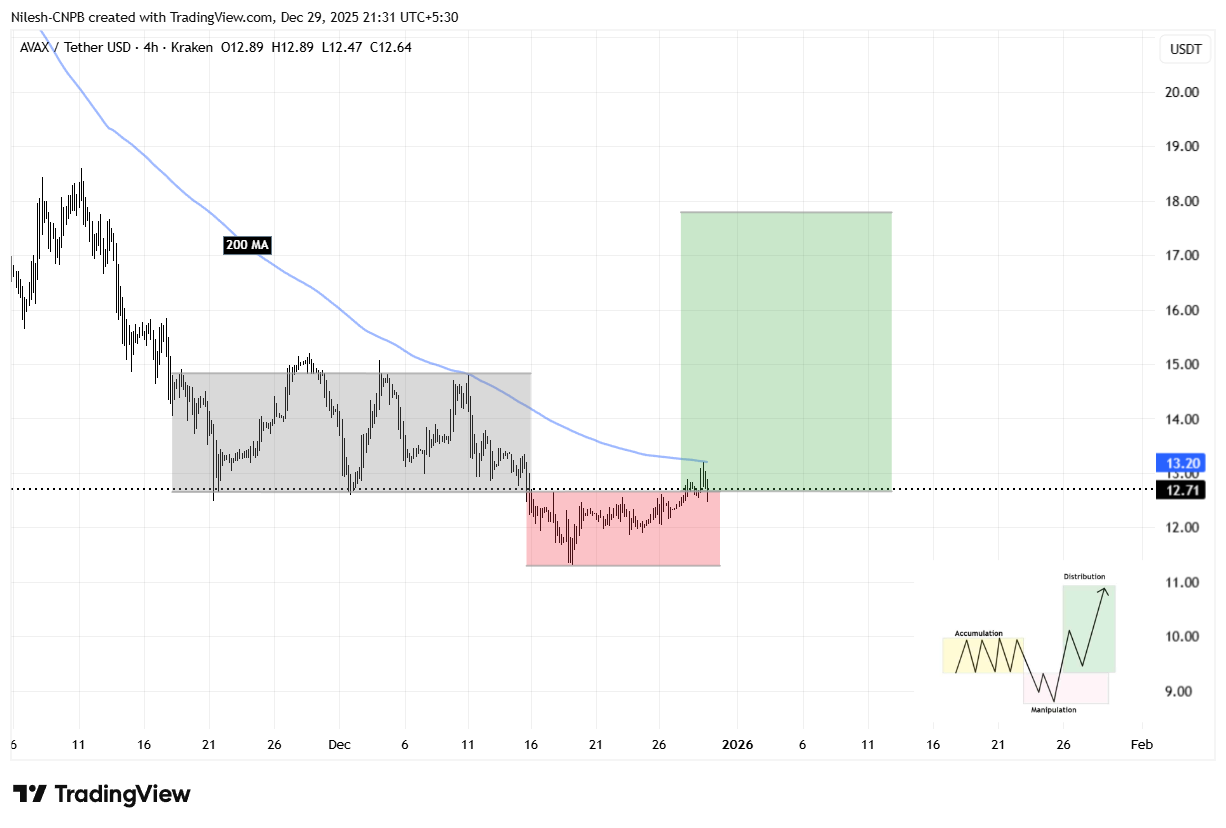
AVAX is trading slightly in the red today, but beneath the surface, its price structure is beginning to tell a more constructive story. The 4-hour chart reveals a high-probability bullish setup that could hint at a stronger upside move once momentum fully shifts back in favor of buyers.

Source: Coinmarketcap
Power of 3 Pattern Takes Shape
On the 4-hour timeframe, AVAX appears to be forming a classic Power of 3 (PO3) pattern — a structure commonly linked to smart money accumulation and trend continuation. This pattern typically unfolds in three distinct phases: accumulation, manipulation, and expansion, often preceding a sharp directional move.
Accumulation Phase
During the accumulation phase, AVAX spent an extended period trading sideways within a defined range, capped by resistance near $14.80 and supported around $12.64. This tight consolidation reflected balance between buyers and sellers, allowing larger participants to quietly build positions while volatility remained compressed.
The prolonged range-bound action signaled that selling pressure was gradually being absorbed, even as the broader trend remained weak.
Manipulation Flush
The manipulation phase played out when AVAX briefly broke below the $12.64 support, triggering a sharp downside move toward the $11.31 area. This sudden drop resembles a classic liquidity sweep, where stop-loss orders and late sellers are flushed out before a reversal takes place.
Avalanche (AVAX) 4H Chart/Coinsprobe (Source: Tradingview)
Expansion Phase Begins to Unfold
Following the sweep of lows, AVAX rebounded quickly and reclaimed the $12.64 level, signaling that buyers have stepped back in with conviction. This recovery suggests the early stages of the expansion phase may now be underway.
Price is currently pushing toward the 200-hour moving average near $13.20, a level that has consistently acted as dynamic resistance during the broader downtrend. A sustained move above this moving average would represent a meaningful shift in short-term momentum and strengthen the bullish reversal narrative.
What’s Next for AVAX?
If AVAX manages to break and hold above the 200-hour moving average, the next major resistance lies at $14.80 — the upper boundary of the prior accumulation range. A decisive reclaim of this zone would confirm a bullish breakout and likely attract fresh momentum participation.
Based on the Power of 3 structure, a successful breakout could open the door for a measured move toward the $18.29 region, derived from projecting the height of the accumulation range upward from the breakout point. This target aligns closely with the expansion zone highlighted on the chart.
That said, caution remains necessary. A failure to hold above $12.64 would weaken the expansion thesis and could force AVAX back into consolidation, delaying any meaningful upside continuation.
For now, AVAX sits at a technically critical inflection point. The structure suggests that smart money positioning may already be in progress, with the coming sessions likely to determine whether the expansion phase fully materializes.
Disclaimer: The views and analysis presented in this article are for informational purposes only and reflect the author’s perspective, not financial advice. Technical patterns and indicators discussed are subject to market volatility and may or may not yield the anticipated results. Investors are advised to exercise caution, conduct independent research, and make decisions aligned with their individual risk tolerance.
About Author: Nilesh Hembade is the Founder and Lead Author of Coinsprobe, with over 5 years of experience in the cryptocurrency and blockchain industry. Since launching Coinsprobe in 2023, he has been providing daily, research-driven insights through in-depth market analysis, on-chain data, and technical research.

Disclaimer: The information on this page may come from third parties and does not represent the views or opinions of Gate. The content displayed on this page is for reference only and does not constitute any financial, investment, or legal advice. Gate does not guarantee the accuracy or completeness of the information and shall not be liable for any losses arising from the use of this information. Virtual asset investments carry high risks and are subject to significant price volatility. You may lose all of your invested principal. Please fully understand the relevant risks and make prudent decisions based on your own financial situation and risk tolerance. For details, please refer to
Disclaimer.
Related Articles
HYPE Fluctuates Amid Whale Moves: Can Buyers Defend $35?
HYPE faces choppy trading near $35 due to conflicting whale activity.
Accumulation trends show gradual buying and growing long-term investor confidence.
Key support zones at $33.48–$35.19 will determine HYPE’s next
CryptoNewsLand7m ago
Bitcoin spikes to $72k but then shows a “fake bull”? With the ceasefire agreement layered on top and options expiring, undercurrents are roiling in the market
After the U.S. and Iran reached a ceasefire agreement, Bitcoin quickly rebounded to $72,000, indicating how sensitive the market is to macro events. However, derivatives market data shows that this rally was mainly driven by easing hedging sentiment rather than new inflows, and that implied volatility in the options market has fallen, suggesting that near-term risks are being released. The next few days will be critical: a large amount of Bitcoin and Ethereum options are expected to expire, which could influence the direction of the market.
GateNews13m ago
U.S.-Iran ceasefire talks push Bitcoin past $72k; Ethereum rises 6% in a single day
After U.S. President Trump reached a two-week ceasefire agreement with Iran, the crypto market rebounded. Bitcoin’s price broke above $72,000, while Ethereum rose to about $2,257. Market sentiment shifted from risk aversion to risk-on. The ceasefire news triggered short covering, driving prices higher. In the short term, the outlook for crypto assets will be influenced by global liquidity and macro variables.
GateNews1h ago
Trump cancels the “doomsday,” Bitcoin surges toward $72k, and global markets rebound across the board
After the United States and Iran reached a ceasefire agreement, global financial markets rebounded, and the price of Bitcoin surged sharply, with stock markets around the world rising in tandem. Analysts say Bitcoin is gradually becoming a risk asset that is highly linked to the macroeconomy, and in the future, price movements will be driven by geopolitical factors and liquidity.
GateNews1h ago
The RWA Yield Infrastructure Trade
The essay highlights challenges in direct RWA token exposure, emphasizes the potential in leverage opportunities amid settlement delays, critiques Morpho's governance token structure, and presents Fluid as a more effective token model with stablecoin links.
CoinDesk1h ago
Jiang Zhuoer shorted ETH at 2,242 dollars, saying the bear market cycle has not finished yet
Gate News message, April 8, Leavitt Mining Pool BTC.TOP founder and CEO Jiang Zhuoer posted that he went short ETH at $2242; this is a mid-to-short-term operation, just like the last time he went long at $1850 and closed it out at $2144. Jiang Zhuoer said that the bear market cycle hasn’t finished yet, and event-driven bounces are opportunities to go short as well; there’s also a small chance that he will start another round again.
GateNews1h ago
