
Key Takeaways
-
Pump.fun (PUMP) has surged over 18% recently, extending its monthly gains to nearly 60%.
-
The daily chart shows a clear inverse head and shoulders pattern, a classic bullish reversal setup.
-
PUMP has reclaimed the 50-day moving average, which is now acting as key short-term support.
-
The $0.003025 neckline resistance is the critical breakout level to watch.
-
A confirmed breakout could target $0.004612, implying a potential 53% upside.
Pump.fun (PUMP), the native token of the popular Solana-based launchpad protocol, is quietly gaining traction in the crypto market. After posting a sharp 18%+ rally, PUMP has now extended its monthly gains to nearly 60%. While the price surge has caught traders’ attention, a closer look at the daily chart structure suggests this move could be part of a larger bullish setup — provided a key resistance level is cleared.
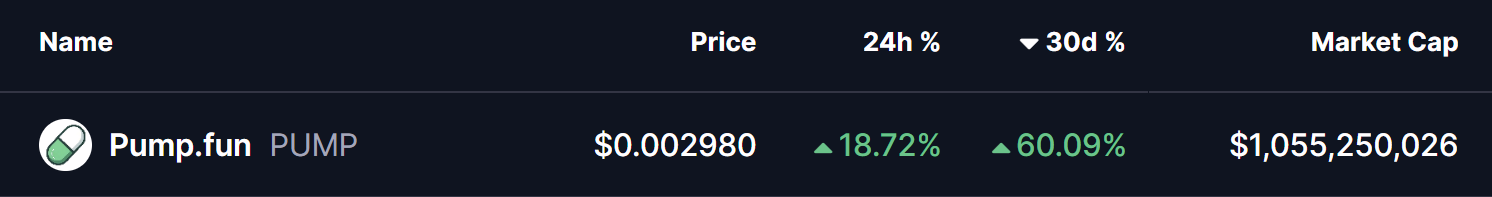
Source: Coinmarketcap
Inverse Head and Shoulders Pattern Takes Shape
On the daily timeframe, PUMP has carved out a well-defined inverse head and shoulders pattern, one of the most widely followed bullish reversal formations in technical analysis.
-
The left shoulder formed in early December near the $0.00247 region.
-
This was followed by a deeper pullback toward $0.00167, creating the head of the structure.
-
Price then recovered and found support again near $0.00225, completing the right shoulder.
Following the formation of this structure, PUMP rebounded steadily and has successfully reclaimed the 50-day moving average, which is now acting as dynamic support. The token is currently consolidating just below the neckline resistance around $0.003025, a level clearly highlighted on the chart.
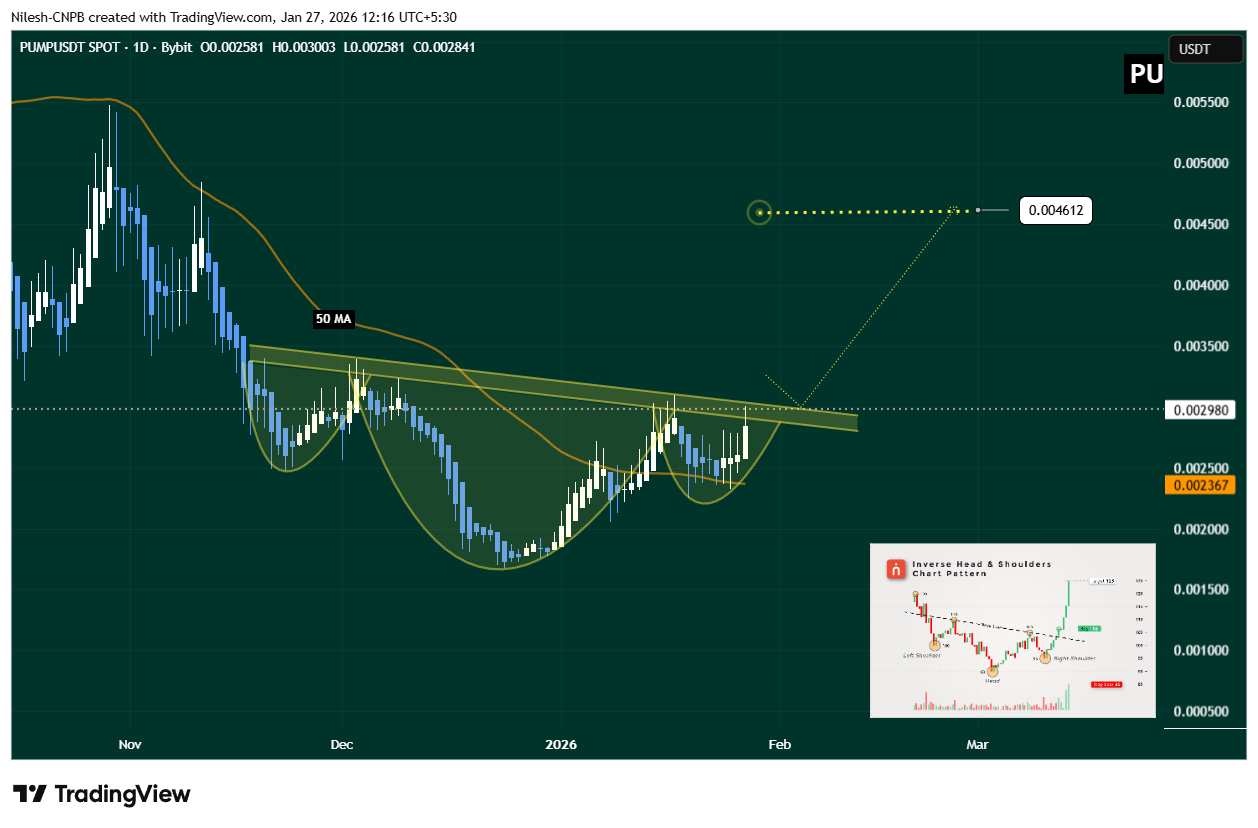
Pump.fun (PUMP) Daily Chart/Coinsprobe (Source: Tradingview)
This tightening price action near resistance often precedes a volatility expansion, suggesting a decisive move could be approaching.
What’s Next for PUMP?
For bullish momentum to gain confirmation, PUMP needs a strong daily close above the $0.003025 neckline, ideally followed by a successful retest of this zone as support. Such a move would validate the inverse head and shoulders breakout and signal a shift in short-term market structure.
Based on the measured move from the inverse head and shoulders pattern, a confirmed breakout could open the door for a price target near $0.004612 — representing a potential 53% upside from the breakout zone.
On the downside, failure to clear the neckline could lead to further consolidation. In that scenario, holding above the 50-day moving average and the $0.002367 support zone will be critical to keep the broader bullish setup intact.
Bottom Line
PUMP’s recent rally appears to be supported by a constructive chart pattern and improving momentum. As long as price continues to coil beneath neckline resistance while holding key support levels, the probability of a breakout remains elevated.
A decisive move above $0.003025 could mark the start of a fresh upside leg, while rejection would likely extend the current consolidation.
Disclaimer: The views and analysis presented in this article are for informational purposes only and reflect the author’s perspective, not financial advice. Technical patterns and indicators discussed are subject to market volatility and may or may not yield the anticipated results. Investors are advised to exercise caution, conduct independent research, and make decisions aligned with their individual risk tolerance.
About Author: Nilesh Hembade is the Founder and Lead Author of Coinsprobe, with over 5 years of experience in the cryptocurrency and blockchain industry. Since launching Coinsprobe in 2023, he has been providing daily, research-driven insights through in-depth market analysis, on-chain data, and technical research.
Disclaimer: The information on this page may come from third parties and does not represent the views or opinions of Gate. The content displayed on this page is for reference only and does not constitute any financial, investment, or legal advice. Gate does not guarantee the accuracy or completeness of the information and shall not be liable for any losses arising from the use of this information. Virtual asset investments carry high risks and are subject to significant price volatility. You may lose all of your invested principal. Please fully understand the relevant risks and make prudent decisions based on your own financial situation and risk tolerance. For details, please refer to
Disclaimer.
Related Articles
Should investors buy TAO right now or wait for the price to drop below $300?
Bittensor (TAO) remains resilient above the psychological level of $300, contrasting with the declines of Bitcoin and Ethereum. A confirmed bullish structure and rising demand for decentralized AI infrastructure support its strength, though a potential correction may offer buying opportunities.
TapChiBitcoin3m ago
PEPE Whales Move $20.7M—Is a Breakout or Breakdown Next?
PEPE whales withdrew $20.7M PEPE, reducing supply and easing sell pressure.
Price holds support, with compression building below key resistance level.
Rising OI and positive funding signal growing bullish momentum and breakout potential.
PepeCoin — PEPE, recently flashed a signal that
CryptoNewsLand32m ago
Bitcoin ETF ends seven consecutive days of gains, Bitcoin price pressure reappears.
Recently, after a continuous net inflow into the U.S. Bitcoin spot ETF for seven trading days, a significant outflow occurred, with a net outflow of $163.5 million on the 18th and another outflow of $51.9 million on the 19th, indicating a simultaneous weakening of market funds and prices. Bitcoin's price briefly fell below $70,000, highlighting that the fund flows from the ETF can no longer support its rebound, and the deteriorating macro environment is putting pressure on risk assets, leading to a noticeable contraction in investor preferences. The testing of the $70,000 level has become a barometer for short-term market sentiment.
区块客32m ago
The RWA Yield Infrastructure Trade
The essay highlights challenges in direct RWA token exposure, emphasizes the potential in leverage opportunities amid settlement delays, critiques Morpho's governance token structure, and presents Fluid as a more effective token model with stablecoin links.
CoinDesk48m ago
Gold plummets, "safe haven for funds" changes hands? JPMorgan: During wartime, "Bitcoin becomes the new darling of hedging."
JPMorgan Chase指出,在中东冲突中,比特币展现出强大的抗跌韧性,资金大规模涌入,交易活动活跃,而黄金和白银则面临资金外流。在高利率和强势美元的压力下,黄金价格下跌约15%。比特币凭借无国界特性成为避险选择,机构投资者也调整了布局,显示黄金流动性下降,而比特币流动性上升。
区块客57m ago
The cryptocurrency fear index has dropped to 9, with the market continuing to maintain "extreme fear."
The current cryptocurrency market fear and greed index has dropped to 9, indicating extreme fear in the market, well below yesterday's 12 and last month's average of 13. This index consolidates multiple indicators to assess market sentiment.
BlockBeatNews1h ago
