
Key Takeaways
-
Ondo (ONDO) has recorded an all-time high TVL of $2.52 billion, rising over 31% in the past 30 days, signaling strong on-chain growth.
-
Active addresses, holders, and stablecoin market cap have all surged sharply, despite ONDO’s recent price correction.
-
The daily chart shows a right-angled descending broadening wedge, a structure that often appears near potential trend reversals.
The real-world asset (RWA) token Ondo (ONDO) has faced notable pressure in recent weeks, sliding nearly 13% over the past month amid the broader crypto market correction. However, while price action has remained under stress, on-chain data and chart structure tell a very different story — one that hints at growing accumulation and a potential bullish rebound forming beneath the surface.
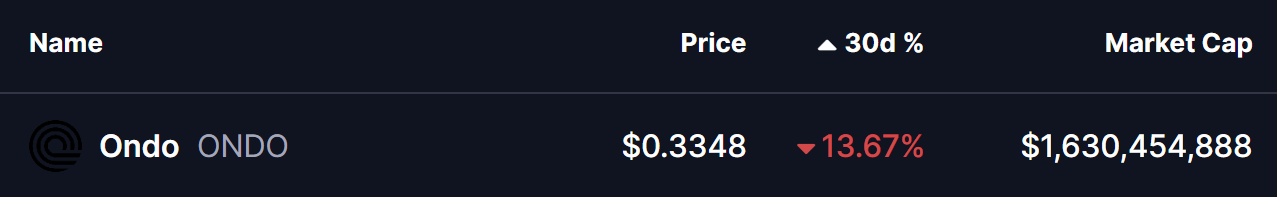
Source: Coinmarketcap
On-Chain Activity Surges Despite Price Weakness
According to the latest data from RWA.xyz, Ondo’s fundamentals continue to strengthen at an impressive pace. The protocol has now recorded an all-time high total value locked (TVL) of $2.52 billion, marking a 31.15% increase in just the past 30 days — a strong signal of rising institutional and on-chain demand.
Other key on-chain metrics are also trending higher:
-
Stablecoin market cap: $74.28 million, up 118% month-over-month
-
Total holders: 67,745, up 34.8% in 30 days
-
Monthly active addresses: 83,519, surging more than 210%
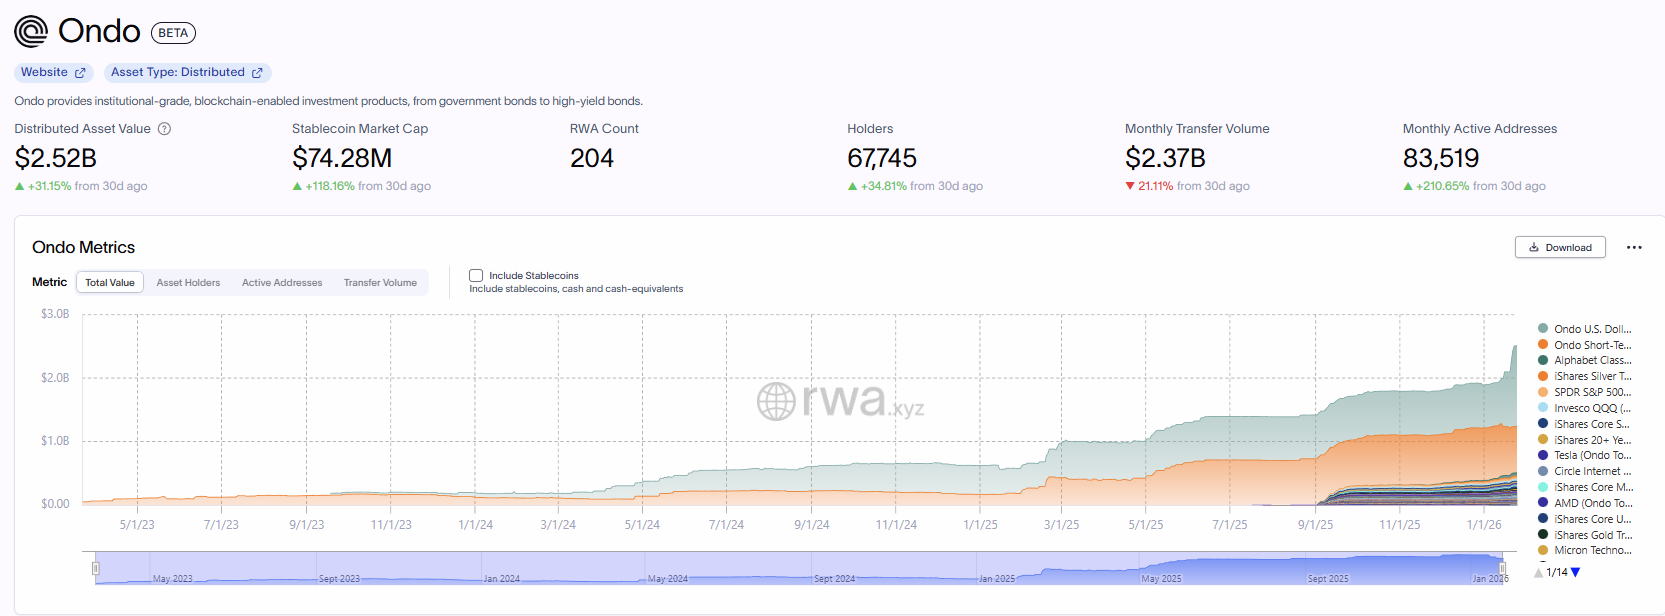
Source: rwa.xyz
This sharp rise in participation and capital flow suggests that users and institutions are increasingly engaging with Ondo’s RWA ecosystem, even as the token’s price consolidates near cycle lows.
Is a Bullish Rebound Taking Shape?
From a technical perspective, ONDO’s daily chart is carving out a right-angled descending broadening wedge — a structure commonly seen during prolonged corrections that can precede trend reversals once selling pressure begins to fade.
This pattern has been developing since ONDO’s rejection from the $1.00–$1.17 resistance zone in September 2025. Since then, price has continued to form lower highs, while volatility has expanded, driving ONDO toward the lower boundary of the wedge near $0.32.
Encouragingly, that support zone has now been successfully defended. Buyers have stepped in near the lower trendline, with ONDO currently hovering around $0.335, suggesting that downside momentum may be weakening after weeks of sustained selling.
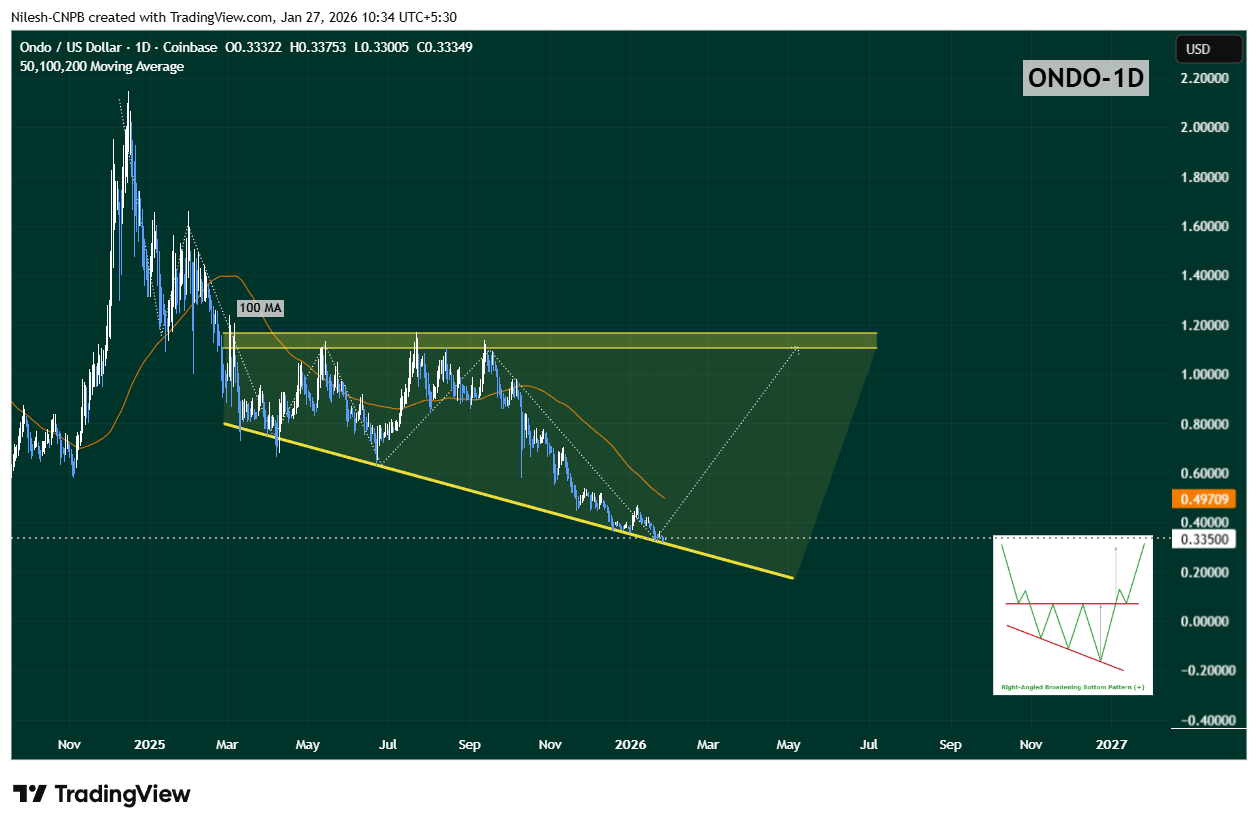
Ondo (ONDO) Daily Chart/Coinsprobe (Source: Tradingview)
Despite early stabilization, upside momentum remains capped for now. The 100-day moving average, sitting near $0.4970, has flipped into strong overhead resistance. Every prior relief rally has stalled below this level, making it a key hurdle for bulls.
Until ONDO can reclaim this moving average, any upside move should be treated as a relief bounce within consolidation, rather than a confirmed trend reversal.
What’s Next for ONDO?
As long as ONDO continues to hold above the $0.32 support zone, the right-angled descending broadening wedge remains valid. Sustained defense of this level keeps the door open for a recovery attempt, especially if price begins posting higher daily or weekly closes.
A reclaim of the 50-day moving average, followed by a breakout above the 100-day MA, would mark a clear shift in momentum. If that scenario plays out, ONDO could gradually advance toward the upper boundary of the wedge, currently aligning near the $1.10–$1.17 region — a move that would represent a major recovery from current levels.
However, a decisive breakdown below the wedge support would invalidate the bullish setup and likely lead to another phase of downside or extended consolidation.
Bottom Line
While ONDO’s price remains under pressure, the disconnect between price action and on-chain growth is becoming increasingly difficult to ignore. Record-high TVL, surging active addresses, and expanding holder counts suggest strong accumulation is taking place beneath the surface.
Combined with a technically constructive wedge pattern near long-term support, ONDO may be approaching a pivotal inflection point — one where fundamentals and structure align for a potential bullish rebound, provided key support levels continue to hold.
Disclaimer: The views and analysis presented in this article are for informational purposes only and reflect the author’s perspective, not financial advice. Technical patterns and indicators discussed are subject to market volatility and may or may not yield the anticipated results. Investors are advised to exercise caution, conduct independent research, and make decisions aligned with their individual risk tolerance.
About Author: Nilesh Hembade is the Founder and Lead Author of Coinsprobe, with over 5 years of experience in the cryptocurrency and blockchain industry. Since launching Coinsprobe in 2023, he has been providing daily, research-driven insights through in-depth market analysis, on-chain data, and technical research.
Disclaimer: The information on this page may come from third parties and does not represent the views or opinions of Gate. The content displayed on this page is for reference only and does not constitute any financial, investment, or legal advice. Gate does not guarantee the accuracy or completeness of the information and shall not be liable for any losses arising from the use of this information. Virtual asset investments carry high risks and are subject to significant price volatility. You may lose all of your invested principal. Please fully understand the relevant risks and make prudent decisions based on your own financial situation and risk tolerance. For details, please refer to
Disclaimer.
Related Articles
Should investors buy TAO right now or wait for the price to drop below $300?
Bittensor (TAO) remains resilient above the psychological level of $300, contrasting with the declines of Bitcoin and Ethereum. A confirmed bullish structure and rising demand for decentralized AI infrastructure support its strength, though a potential correction may offer buying opportunities.
TapChiBitcoin3m ago
PEPE Whales Move $20.7M—Is a Breakout or Breakdown Next?
PEPE whales withdrew $20.7M PEPE, reducing supply and easing sell pressure.
Price holds support, with compression building below key resistance level.
Rising OI and positive funding signal growing bullish momentum and breakout potential.
PepeCoin — PEPE, recently flashed a signal that
CryptoNewsLand31m ago
Bitcoin ETF ends seven consecutive days of gains, Bitcoin price pressure reappears.
Recently, after a continuous net inflow into the U.S. Bitcoin spot ETF for seven trading days, a significant outflow occurred, with a net outflow of $163.5 million on the 18th and another outflow of $51.9 million on the 19th, indicating a simultaneous weakening of market funds and prices. Bitcoin's price briefly fell below $70,000, highlighting that the fund flows from the ETF can no longer support its rebound, and the deteriorating macro environment is putting pressure on risk assets, leading to a noticeable contraction in investor preferences. The testing of the $70,000 level has become a barometer for short-term market sentiment.
区块客32m ago
The RWA Yield Infrastructure Trade
The essay highlights challenges in direct RWA token exposure, emphasizes the potential in leverage opportunities amid settlement delays, critiques Morpho's governance token structure, and presents Fluid as a more effective token model with stablecoin links.
CoinDesk48m ago
Gold plummets, "safe haven for funds" changes hands? JPMorgan: During wartime, "Bitcoin becomes the new darling of hedging."
JPMorgan Chase指出,在中东冲突中,比特币展现出强大的抗跌韧性,资金大规模涌入,交易活动活跃,而黄金和白银则面临资金外流。在高利率和强势美元的压力下,黄金价格下跌约15%。比特币凭借无国界特性成为避险选择,机构投资者也调整了布局,显示黄金流动性下降,而比特币流动性上升。
区块客57m ago
The cryptocurrency fear index has dropped to 9, with the market continuing to maintain "extreme fear."
The current cryptocurrency market fear and greed index has dropped to 9, indicating extreme fear in the market, well below yesterday's 12 and last month's average of 13. This index consolidates multiple indicators to assess market sentiment.
BlockBeatNews1h ago
