
Key Takeaways
-
SAND price is showing early signs of stabilization after recent downside pressure.
-
Buyers appear to be defending a key support zone, hinting at a potential short-term rebound.
-
A breakout above nearby resistance could open the door for a stronger recovery move.
Gaming-focused crypto tokens are back in the spotlight after Axie Infinity (AXS) posted a sharp rally of over 16% in a single day and more than 246% over the past month, reigniting optimism around the gaming narrative. Riding this renewed momentum, Sandbox (SAND) has also stepped into focus, climbing nearly 45% as overall market sentiment turns constructive.
Beyond the recent price bounce, the technical structure on the chart is starting to tell a bigger story, hinting that SAND may be setting up for a bullish continuation move.
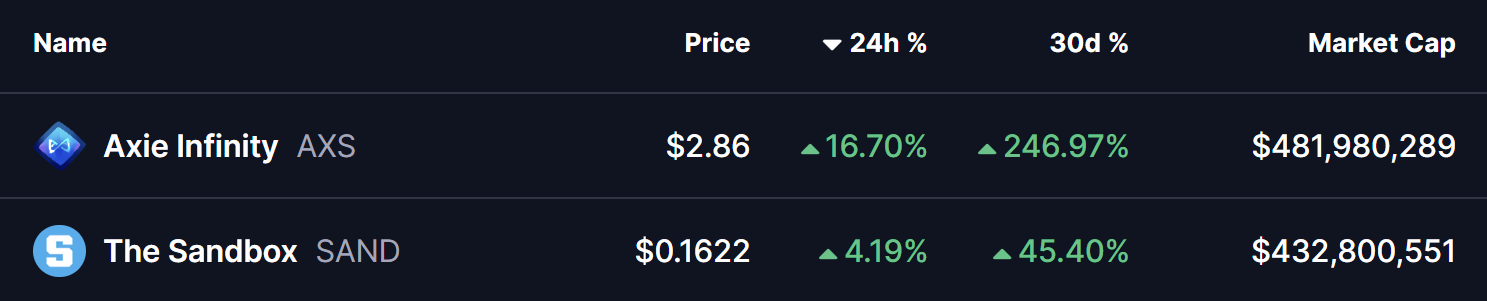
Source: Coinmarketcap
Descending Broadening Wedge Pattern in Play
On the daily timeframe, SAND is trading within a descending broadening wedge — a bullish reversal pattern that often develops during corrective phases before a trend shift. This structure reflects increasing volatility, with price gradually compressing while buyers quietly regain control.
During the latest pullback, SAND successfully retested the lower boundary of the wedge near the $0.11 zone, an area that has repeatedly acted as strong demand. Buyers stepped in aggressively at this level, triggering a rebound that pushed price toward $0.1711, placing SAND right near the wedge’s upper resistance trendline.
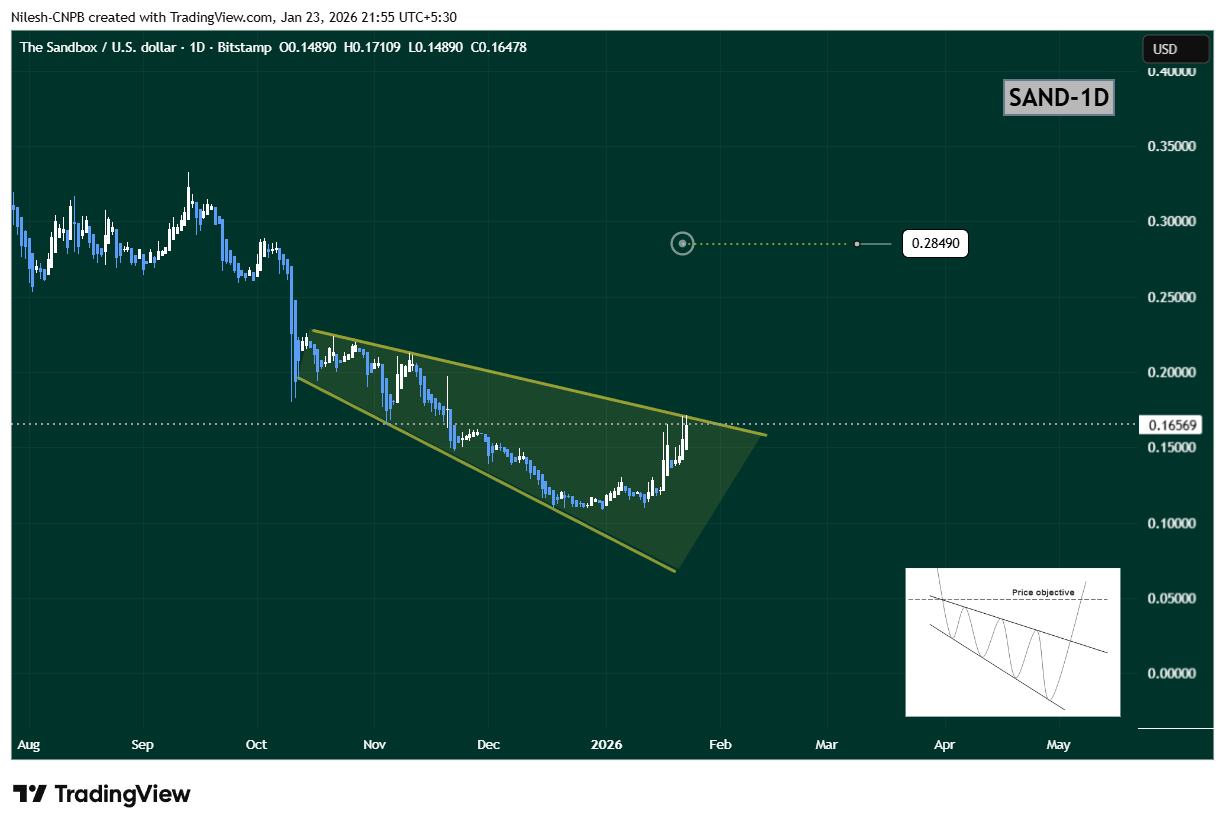
Sandbox (SAND) Daily Chart/Coinsprobe (Source: Tradingview)
The steady rise toward this upper boundary suggests growing bullish momentum and increasing breakout pressure.
What’s Next for SAND?
If buyers manage to push SAND above the upper wedge resistance near $0.1711, it would confirm a bullish breakout from the pattern. In that scenario, the chart opens the door for a move toward the $0.2849 target, which aligns with the measured move of the wedge and represents roughly 73% upside from current levels.
However, if price faces rejection at resistance, SAND could continue consolidating within the wedge structure. In that case, the $0.13–$0.14 region will act as an important short-term support zone to watch.
Bottom Line
SAND’s overall technical structure remains constructive. With a bullish descending broadening wedge in play, buyers defending key support, and gaming tokens gaining renewed attention, Sandbox appears to be positioning for a potential breakout. A confirmed move above resistance could mark the beginning of a stronger upside phase in the sessions ahead.
Disclaimer: The views and analysis presented in this article are for informational purposes only and reflect the author’s perspective, not financial advice. Technical patterns and indicators discussed are subject to market volatility and may or may not yield the anticipated results. Investors are advised to exercise caution, conduct independent research, and make decisions aligned with their individual risk tolerance.
About Author: Nilesh Hembade is the Founder and Lead Author of Coinsprobe, with over 5 years of experience in the cryptocurrency and blockchain industry. Since launching Coinsprobe in 2023, he has been providing daily, research-driven insights through in-depth market analysis, on-chain data, and technical research.
Disclaimer: The information on this page may come from third parties and does not represent the views or opinions of Gate. The content displayed on this page is for reference only and does not constitute any financial, investment, or legal advice. Gate does not guarantee the accuracy or completeness of the information and shall not be liable for any losses arising from the use of this information. Virtual asset investments carry high risks and are subject to significant price volatility. You may lose all of your invested principal. Please fully understand the relevant risks and make prudent decisions based on your own financial situation and risk tolerance. For details, please refer to
Disclaimer.
Related Articles
QCP: BTC Oscillates Near $74,000; Multi-Country Central Bank Rate Decisions Key This Week
QCP Capital analysis indicates that BTC price is maintaining around $74,000, with a lack of upward momentum. Although the overall crypto market remains under pressure, the declines are relatively controlled. Central bank policy meetings throughout the year will influence the market, as high oil prices have lowered expectations for rate cuts, and the interest rate environment has weakened support for crypto assets. Until policy and geopolitical situations become clearer, a volatile pattern may continue.
GateNews45m ago
Analyst: The overheated bubble of Bitcoin (BTC) has been absorbed, but selling pressure still remains.
On-chain analyst Axel's research report indicates that the Bitcoin market has returned to a neutral range, but overall remains in a loss state with unrelenting selling pressure. The MVRV Z-Score shows that valuation bubbles have dissipated; however, aSOPR has remained below 1.0 for 55 consecutive days, indicating sustained selling pressure. Axel emphasizes that the key to the market lies in whether selling pressure will be exhausted, requiring observation of whether aSOPR can stabilize above 1.0.
動區BlockTempo1h ago
Citigroup Slashes Bitcoin and Ethereum 12-Month Price Targets, Citing Stalled U.S. Crypto Legislation Weighing on Upside Catalysts
Citigroup has lowered its 12-month price targets for Bitcoin and Ethereum, signaling a shift toward caution on the cryptocurrency market's medium-term outlook, primarily due to slow progress in U.S. crypto asset legislation. Bitcoin's target was reduced from $143,000 to $112,000, while Ethereum's fell to $3,175. Despite upside potential remaining in the future, the lack of new policy catalysts suggests prices may oscillate within a range in the near term. Citigroup's assessment of Ethereum is more cautious, as it believes the asset is more significantly impacted by on-chain activity.
区块客1h ago
Bitcoin Holds Strong at $70,000! On-Chain Data Reveals "Collective Selling Wave," Retail Investors Emerge as Biggest Selling Pressure
Under Middle East geopolitical tensions, Bitcoin faced widespread selling pressure, particularly from retail holders. According to Glassnode data, the market is experiencing heavy selling pressure, with the accumulated trend score declining to 0.04, indicating that retail and small-to-medium investors are reducing their positions significantly. Despite this, Bitcoin's resilience against the decline has surprised market observers.
区块客2h ago
ENJ Rockets Past $0.027 — 23% Surge Signals Momentum
Enjin Coin has surged 22.96% in 30 minutes, reaching $0.02737, reflecting increased trading activity and market interest. With a 24-hour change of +43.30%, traders are monitoring support at $0.025 and resistance at $0.030, suggesting potential trends ahead.
Coinfomania2h ago
Ethereum Returns to $2,300: Whales Accumulate 540,000 ETH, Exchange Inflows Drop to 10-Month Low
Ethereum's price rebounded above $2,300 on March 18, primarily driven by whale purchases and net exchange outflows. On-chain data shows investors have reduced their selling pressure, with supply tightening. Technical indicators reveal short-term resistance at $2,380 to $2,400, with support near $2,320. The futures market is also displaying positive signals.
GateNews2h ago
