
Key Takeaways
-
SAND price is showing early signs of stabilization after recent downside pressure.
-
Buyers appear to be defending a key support zone, hinting at a potential short-term rebound.
-
A breakout above nearby resistance could open the door for a stronger recovery move.
Gaming-focused crypto tokens are back in the spotlight after Axie Infinity (AXS) posted a sharp rally of over 16% in a single day and more than 246% over the past month, reigniting optimism around the gaming narrative. Riding this renewed momentum, Sandbox (SAND) has also stepped into focus, climbing nearly 45% as overall market sentiment turns constructive.
Beyond the recent price bounce, the technical structure on the chart is starting to tell a bigger story, hinting that SAND may be setting up for a bullish continuation move.
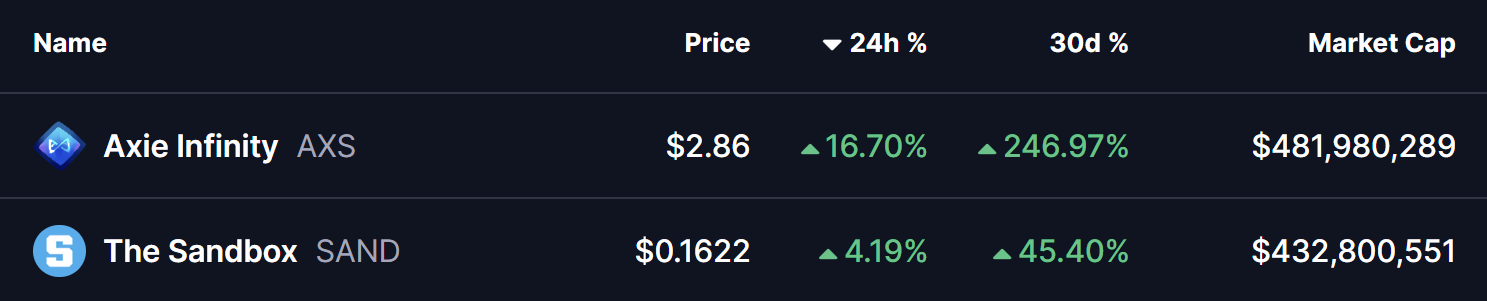
Source: Coinmarketcap
Descending Broadening Wedge Pattern in Play
On the daily timeframe, SAND is trading within a descending broadening wedge — a bullish reversal pattern that often develops during corrective phases before a trend shift. This structure reflects increasing volatility, with price gradually compressing while buyers quietly regain control.
During the latest pullback, SAND successfully retested the lower boundary of the wedge near the $0.11 zone, an area that has repeatedly acted as strong demand. Buyers stepped in aggressively at this level, triggering a rebound that pushed price toward $0.1711, placing SAND right near the wedge’s upper resistance trendline.
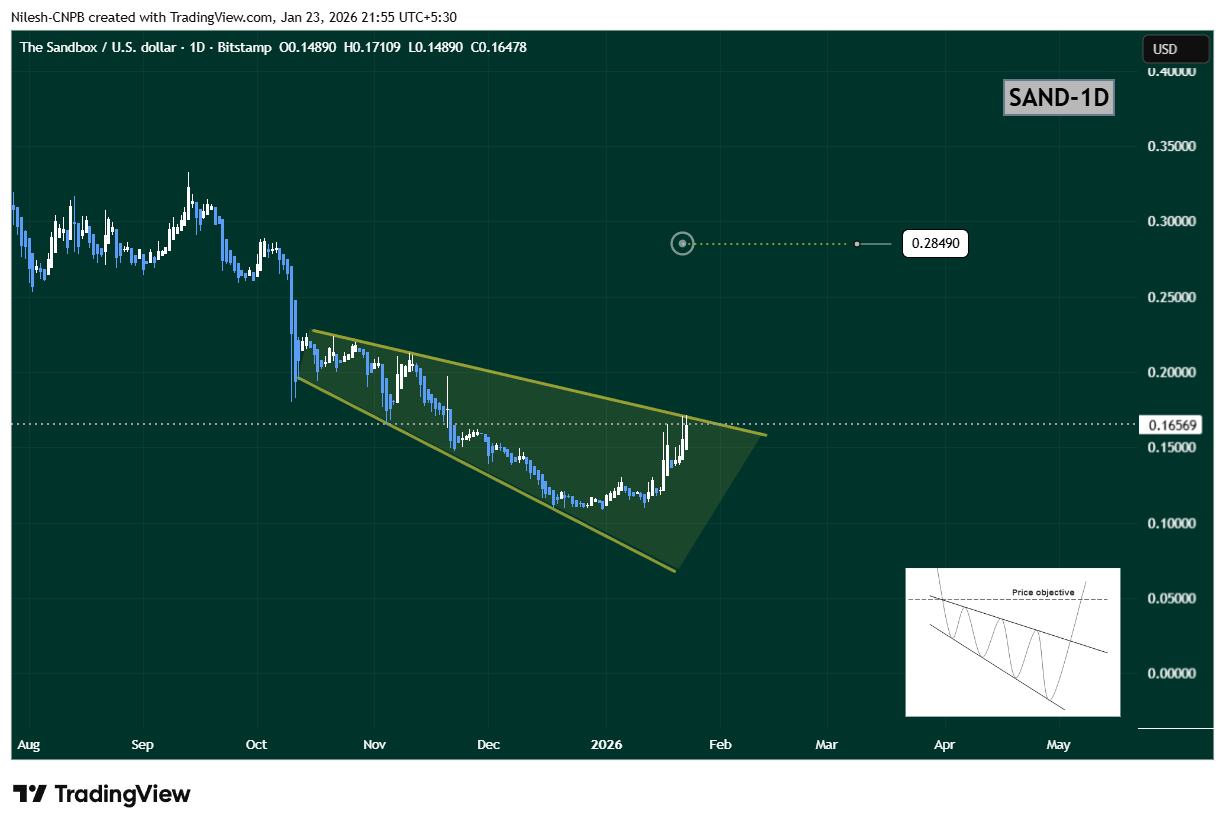
Sandbox (SAND) Daily Chart/Coinsprobe (Source: Tradingview)
The steady rise toward this upper boundary suggests growing bullish momentum and increasing breakout pressure.
What’s Next for SAND?
If buyers manage to push SAND above the upper wedge resistance near $0.1711, it would confirm a bullish breakout from the pattern. In that scenario, the chart opens the door for a move toward the $0.2849 target, which aligns with the measured move of the wedge and represents roughly 73% upside from current levels.
However, if price faces rejection at resistance, SAND could continue consolidating within the wedge structure. In that case, the $0.13–$0.14 region will act as an important short-term support zone to watch.
Bottom Line
SAND’s overall technical structure remains constructive. With a bullish descending broadening wedge in play, buyers defending key support, and gaming tokens gaining renewed attention, Sandbox appears to be positioning for a potential breakout. A confirmed move above resistance could mark the beginning of a stronger upside phase in the sessions ahead.
Disclaimer: The views and analysis presented in this article are for informational purposes only and reflect the author’s perspective, not financial advice. Technical patterns and indicators discussed are subject to market volatility and may or may not yield the anticipated results. Investors are advised to exercise caution, conduct independent research, and make decisions aligned with their individual risk tolerance.
About Author: Nilesh Hembade is the Founder and Lead Author of Coinsprobe, with over 5 years of experience in the cryptocurrency and blockchain industry. Since launching Coinsprobe in 2023, he has been providing daily, research-driven insights through in-depth market analysis, on-chain data, and technical research.
Disclaimer: The information on this page may come from third parties and does not represent the views or opinions of Gate. The content displayed on this page is for reference only and does not constitute any financial, investment, or legal advice. Gate does not guarantee the accuracy or completeness of the information and shall not be liable for any losses arising from the use of this information. Virtual asset investments carry high risks and are subject to significant price volatility. You may lose all of your invested principal. Please fully understand the relevant risks and make prudent decisions based on your own financial situation and risk tolerance. For details, please refer to
Disclaimer.
Related Articles
XRP Burn Rate Surges 313% as Network Activity Climbs
Key Insights
XRP burn rate surged 313% in one day, reaching 2,491 tokens, reflecting strong transaction growth and heightened network demand during the recent rally.
Large XRP holders increased, with addresses holding over 100,000 XRP rising to 32,054, signaling continued accumulation
CryptoNewsLand50m ago
Shiba Inu Price Tests Key Support as Selling Pressure Builds
Shiba Inu's price fell 4.3% to $0.000005965, with sellers dominating. Immediate support is at $0.00000595, while Bollinger Bands indicate potential downside to $0.00000533. Long traders faced losses, reflecting a market lacking direction.
CryptoNewsLand54m ago
This Oversold Signal Has Triggered 350%, 1,800%, and 2,700% Bitcoin Surges Before
Although it has performed relatively well since the war in the Middle East broke out nearly a month ago, and has dwarfed gold in terms of gains within this period, bitcoin is far from its best shape observed in October last year.
The cryptocurrency trades nearly 50% below its all-time high of
CryptoPotato1h ago
Bitcoin Likely to Fall to $60,000 As Active Addresses Decline, Signaling On-Chain Market Activity...
The Bitcoin (BTC) cryptocurrency once again appears to be losing momentum, attracting the attention of crypto users and market observers. Today, market analyst CryptoQuant shared insights on the current status of Bitcoin, noting the market appears to have entered a corrective mode, signaling a
BlockChainReporter1h ago
Ripple Price Prediction: XRP Could Explode to $2 but This Has to Happen First
XRP’s price has failed to capitalize on a major move higher this week and has retreated to about $1.44, roughly in line with how the rest of the market has behaved during the same period.
According to popular technical analyst _CRYPTOWZRD, _the altcoin might be poised for another leg up, but
CryptoPotato1h ago
