
The Aster price has been stuck in a tight range for weeks, but that quiet period may not last much longer.
Top analyst Ardi pointed out that the token is in its longest consolidation phase ever. In fact, the chart shows that the token has been trading sideways for close to three weeks.
Instead of the token trading up or down, it has been trading in a tight range, repeatedly testing support without breaking it. At writing, the ASTER token is trading at around $0.71.
Here’s What The ASTER Chart Is Showing
The chart shared by trader Ardi shows that ASTER has been defending a key support area around $0.69–$0.70. Several quick dips into that zone were immediately bought up, which suggests buyers are still active at those levels.
Another detail standing out in the ASTER chart is declining trading volume during the consolidation. That type of behavior often appears when markets are quietly building positions before the next move.
Instead of aggressive buying or selling, traders appear to be waiting. According to the analyst, that combination of stable support and shrinking volume can signal a local accumulation phase.
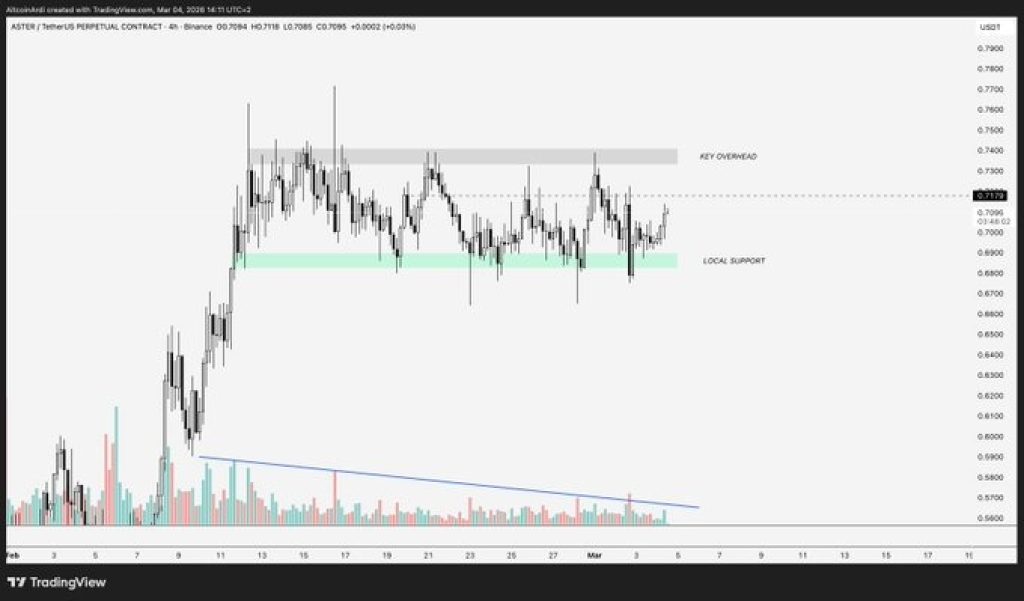
Source: X/Ardi
However, on the upside, the most important level sits around $0.75.That area has acted as a ceiling multiple times during the past few weeks, stopping each rally attempt before it could extend higher.
If the ASTER price manages to break above that level with strong momentum, the next target could come near $0.81, which the analyst describes as a larger macro pivot on the chart.
A move into that region would mark a clear shift in market structure after weeks of sideways action.
_****Pi Coin Price Prediction As Pi Network Prepares Major Upgrade Ahead Of Pi Day**
What’s Next For ASTER?
However, the setup cuts both ways. The longer a market stays trapped in a tight range, the more pressure tends to build. When the breakout finally happens, the move often happens quickly.
If the ASTER price fails to hold the $0.69 support zone, the analyst warns that the downside reaction could be sharp. After weeks of buyers entering the same area, a breakdown could push many of those positions underwater at the same time.
Such a situation may lead to forced selling and drive prices lower.For now, ASTER price remains stuck in a tight range between $0.69-$0.70 support and $0.75 resistance. We’re waiting to see which level will be broken first. Because after three weeks of silence, the next move may not stay quiet for long.
Disclaimer: The information on this page may come from third parties and does not represent the views or opinions of Gate. The content displayed on this page is for reference only and does not constitute any financial, investment, or legal advice. Gate does not guarantee the accuracy or completeness of the information and shall not be liable for any losses arising from the use of this information. Virtual asset investments carry high risks and are subject to significant price volatility. You may lose all of your invested principal. Please fully understand the relevant risks and make prudent decisions based on your own financial situation and risk tolerance. For details, please refer to
Disclaimer.
Related Articles
EDGE (Edge Network) up 3.54% in 24 hours
Gate News reports: On March 20, according to Gate's market data, as of press time, EDGE (Edge Network) is trading at $0.1355, up 3.54% in the past 24 hours, with a high of $0.1635 and a low of $0.1250. The 24-hour trading volume reached $501,500, with a current market cap of approximately $27.543 million.
EDGE is a utility token of the Definitive platform, designed to enhance users' trading experience. Holders can stake EDGE to enjoy lower fees, gain priority access to new features, and unlock exclusive rewards tailored for premium users. Definitive is a high-level trading platform that supports trading any asset on any blockchain, providing Market, Limit, and
GateNews25m ago
Why Did Bitcoin Drop Today? Dormant Whale Awakens After 11 Years and Liquidates Holdings, Hormuz Crisis Spreads
Bitcoin has recently been affected by supply shocks and geopolitical pressures, with prices declining from their highs to approximately $69,500. Large volumes of bitcoin entering exchanges have triggered market panic. Major sellers include dormant wallets resuming activity and early investors taking profits. Technically, bitcoin has broken below the $72,000 support level, with $64,000 becoming a critical support level. A breach of this level could expose the asset to further downside risk.
MarketWhisper50m ago
US-Iran Tensions Escalate, Bitcoin Viewed as "Flight Asset"
US-Iran tensions are escalating, with markets beginning to price in prolonged conflict, impacting oil, shipping, and supply chain costs. Investors are focusing on hard assets and related resource sectors, while facing stagflation risks. It is recommended to adopt defensive trading strategies and currency diversification.
GateNews1h ago
Six Countries' Joint Statement on Defending the Strait of Hormuz, But No Specifics on What to Do? Brent Crude Falls Below $110
The UK, France, Germany, Italy, the Netherlands, and Japan released a joint statement on the 19th, committing to take "appropriate measures" for navigation safety in the Strait of Hormuz, but did not specify concrete actions, leaving political flexibility. The statement condemned Iran's attacks on commercial vessels, demanded its compliance with international law, and supported increased production to stabilize energy markets. This declaration has sparked external scrutiny and analysis, particularly regarding the ambiguity of the term "appropriate measures."
動區BlockTempo1h ago
Solana Price Trend Shows Bearish Technical Pattern, Higher Time Frames Exhibit Weakness
Gate News Report: On March 20, Solana (SOL) price action displayed bearish technical formations on higher timeframes, with the market showing weakness. Technical charts indicate that SOL has formed bearish structures across multiple timeframes, with price action under pressure.
GateNews1h ago
