
Key Takeaways
-
Bitcoin has dropped into a major 10-month support zone between $74,500–$78,600
-
The weekly chart shows a developing head and shoulders structure
-
BTC has corrected nearly 40% from its all-time high near $121,900
-
Reclaiming the 100-week MA around $87,263 could trigger a move toward $109,568
-
A breakdown below support may expose BTC to deeper downside toward the $49,000 region
Bitcoin has entered a critical phase in early February 2026, sliding into a zone that hasn’t been meaningfully tested in nearly ten months. After weeks of sustained selling pressure, BTC has dropped into the $74,500–$78,600 support range, an area that previously acted as a strong base during April-2025.
As of February 2, 2026, Bitcoin is trading near $76,614, down 2.24% over the past 24 hours, with an intraday low touching $74,551. On a broader scale, BTC is now down 12.45% year-to-date, erasing a large portion of the late-2025 rally and pushing market sentiment back into caution mode.
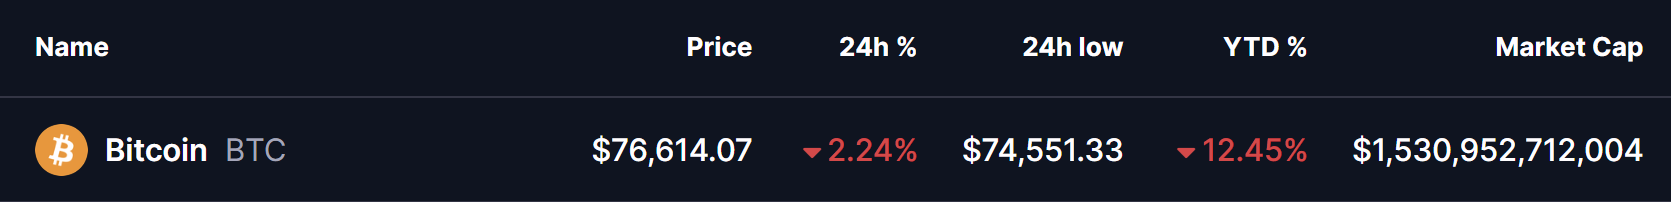
Source: Coinmarketcap
Yet, while price action looks heavy on the surface, the weekly chart structure suggests this move may be more than just panic-driven selling.
A Head and Shoulders Structure Near Completion
On the weekly timeframe, Bitcoin is carving out a developing head and shoulders pattern, a classic structure that often marks a major transition in trend. The “head” of the pattern formed near Bitcoin’s all-time high region around $121,900, from where BTC has corrected roughly 40% at its worst point.
The recent breakdown below the 100-week moving average, currently near $87,263, accelerated downside momentum and dragged price directly into the neckline support zone between $74,500 and $78,600.
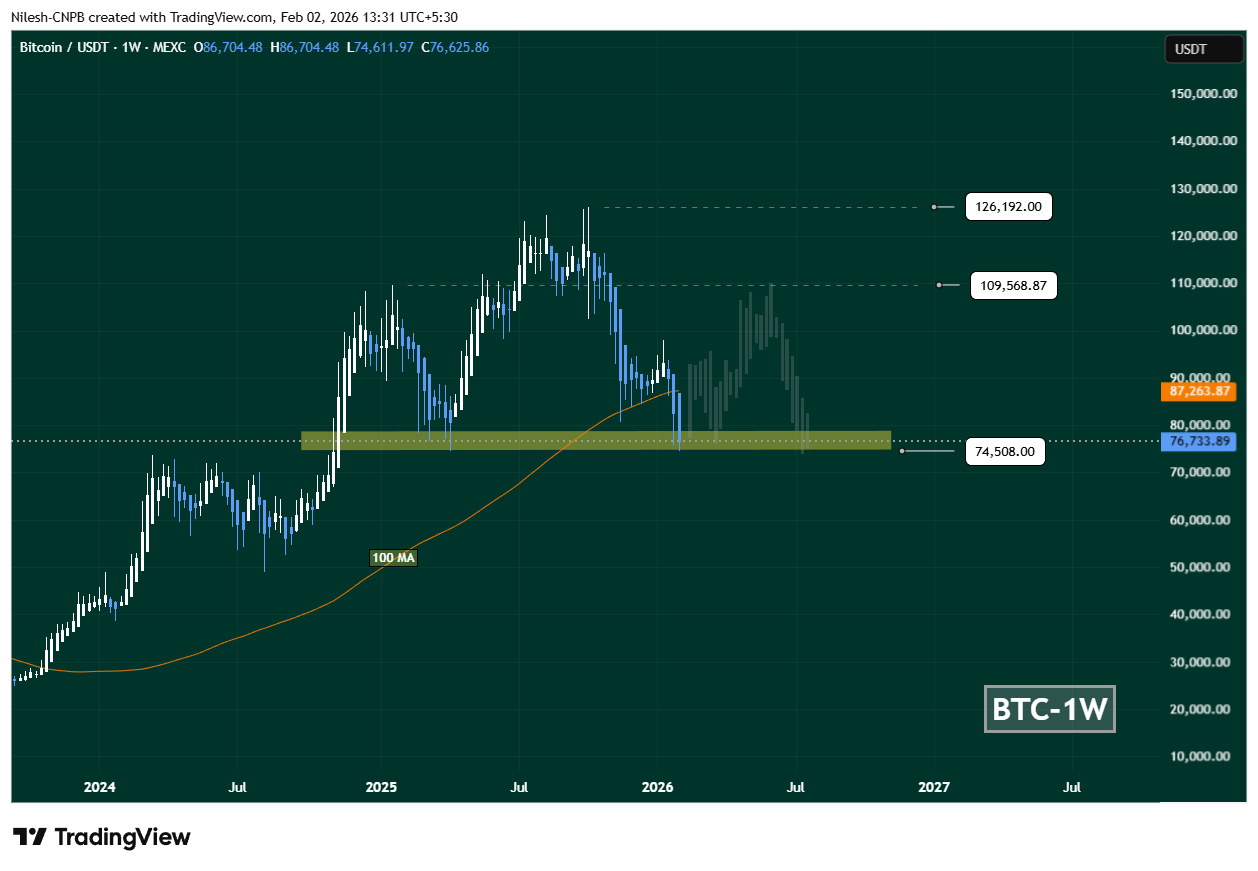
Bitcoin (BTC) Weekly Chart/Coinsprobe (Source: Tradingview)
This neckline is not just a random horizontal level. Historically, it has acted as a high-demand area, absorbing selling pressure and triggering strong rebounds. The latest weekly candle shows a clear downside wick into this zone, hinting that selling momentum may be weakening as buyers cautiously step in.
Liquidity Clusters Hint at a Potential Upside Magnet
Adding weight to the rebound narrative, Coinglass data highlights over $2.60 billion in liquidity stacked above the $87,000 region. This cluster creates a potential upside magnet if price manages to stabilize and reclaim key resistance levels.
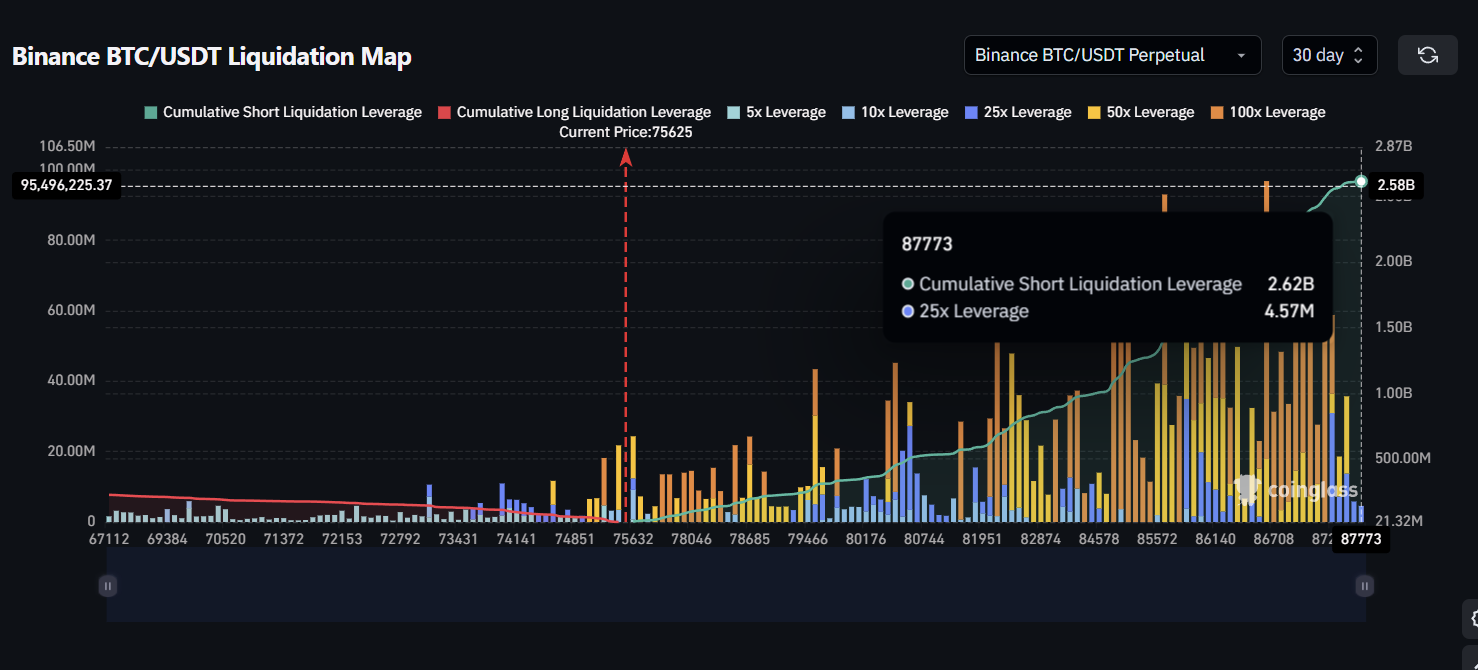
Source: Coinglass
From a market mechanics perspective, such liquidity zones often attract price once downside pressure cools, especially after a prolonged corrective move like the one Bitcoin has just experienced.
What the Chart Suggests Going Forward
If Bitcoin manages to defend the neckline support and reclaims the 100-week MA near $87,263, momentum could shift meaningfully in favor of bulls. In that scenario, a recovery toward the $109,568 region becomes technically plausible — representing a potential 40%+ upside move from current levels.
Such a rally would likely form the right shoulder of the larger head and shoulders structure, leaving BTC at a critical decision point between trend continuation or renewed consolidation.
On the flip side, failure to hold the $74,500–$78,600 zone would significantly weaken the structure. A clean breakdown below this area could open the door to a deeper correction toward the $49,000 region, where the next major liquidity pocket and historical support reside.
The Market’s Defining Moment
For now, Bitcoin is sitting at a make-or-break level. The neckline zone remains the battlefield where bulls and bears are actively fighting for control. How price reacts here will likely set the tone for the next major trend — whether that’s a relief rally driven by liquidity hunts or a continuation of the broader corrective phase.
One thing is clear: this is not a level the market can ignore.
Disclaimer: The views and analysis presented in this article are for informational purposes only and reflect the author’s perspective, not financial advice. Technical patterns and indicators discussed are subject to market volatility and may or may not yield the anticipated results. Investors are advised to exercise caution, conduct independent research, and make decisions aligned with their individual risk tolerance.
About Author: Nilesh Hembade is the Founder and Lead Author of Coinsprobe, with over 5 years of experience in the cryptocurrency and blockchain industry. Since launching Coinsprobe in 2023, he has been providing daily, research-driven insights through in-depth market analysis, on-chain data, and technical research.
Disclaimer: The information on this page may come from third parties and does not represent the views or opinions of Gate. The content displayed on this page is for reference only and does not constitute any financial, investment, or legal advice. Gate does not guarantee the accuracy or completeness of the information and shall not be liable for any losses arising from the use of this information. Virtual asset investments carry high risks and are subject to significant price volatility. You may lose all of your invested principal. Please fully understand the relevant risks and make prudent decisions based on your own financial situation and risk tolerance. For details, please refer to
Disclaimer.
Related Articles
An American musician stole 5.9 BTC by impersonating a Ledger app, resulting in losses of about $420k
Gate News message: On April 13, American musician Garrett Dutton (stage name G. Love) downloaded and used an application that impersonated a Ledger wallet from the App Store. After he entered his recovery phrase, 5.9 BTC was stolen, for an estimated loss of about $420k. On-chain analyst ZachXBT found that the attacker had moved the stolen Bitcoin through some
GateNews25m ago
U.S. Central Command blocks Iranian ports: oil prices surge to $105, while Bitcoin slips to $71,000
U.S. Central Command confirms that, starting April 13, it will impose a maritime blockade on Iranian ports, while international shipping through the Strait of Hormuz is not affected. WTI crude oil prices break above $105, and Bitcoin falls back to around $71,000, with global energy and crypto asset markets responding in sync.
GateInstantTrends36m ago
Michael Saylor hints that Strategy will soon purchase more Bitcoin
Michael Saylor shared a Strategy Bitcoin purchase history chart on the X platform, indicating that it will once again increase its holdings of Bitcoin. Despite the company’s current book loss of $14.5 billion, it still adheres to its long-term allocation strategy, believing that Bitcoin has become a digital reserve for institutional capital. In addition, Saylor’s Sunday chart posting has become an industry-recognized buy-the-dip precursor signal.
MarketWhisper50m ago
South Korean gaming giant NXC trims BTC and ETH, bringing its crypto asset holdings down to 147.6 billion KRW
NXC’s merger audit report shows that as of the end of 2025, its crypto asset holdings were 147.6 billion South Korean won, down 15.2% from the previous year. NXC has sold a stake in a certain exchange and decided to dispose of all its shares in Korbit, while also acquiring the European company CLI Group through its subsidiary to advance business diversification.
GateNews1h ago
'Not Going to Stop at Bitcoin': Morgan Stanley Weighs Tokenization, Tax Solutions in Crypto Push
In brief
Amy Oldenburg, head of digital-asset strategy at Morgan Stanley, sees a tokenized money-market fund as a natural path forward for its crypto roadmap.
What’s more, the investment bank with $9.3 trillion in client
Decrypt1h ago
