Key Takeaways
-
AAVE has dropped nearly 23% in 30 days, but price is now holding a major long-term support zone between $113–$129.
-
The weekly chart shows a potential double bottom pattern, signaling a possible trend reversal if support continues to hold.
-
A reclaim of the 100-week moving average near $137.8 could strengthen bullish momentum and open the path toward $378–$400 resistance.
The broader altcoin market has come under heavy selling pressure over the past few days, with sentiment deteriorating rapidly across major assets. Ethereum (ETH) has plunged more than 28%, setting the tone for the wider market. Unsurprisingly, Aave ($AAVE) hasn’t been spared, shedding nearly 23% over the past 30 days.
While short-term sentiment remains fragile, a closer look at AAVE’s weekly chart suggests price has now reached a technically important area — one that could serve as a foundation for a potential bounce if buyers continue to step in.
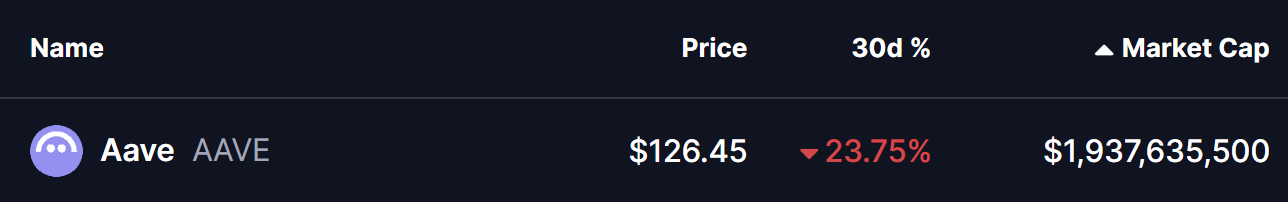
Source: Coinmarketcap
Double Bottom Pattern in Play?
On the weekly timeframe, AAVE appears to be forming a potential double bottom pattern, a classic bullish reversal structure that often develops near the end of prolonged downtrends.
The first bottom formed when AAVE dropped into the $113–$129 support zone, followed by a strong recovery attempt that pushed price toward the neckline resistance between $378 and $400. That rally ultimately faced rejection, but the latest sell-off has brought AAVE right back into the same support region.
What stands out this time is the buyer response. Price has once again stabilized within the $113–$129 zone, suggesting that bulls are actively defending this area and are not yet ready to give up control. The repeated defense of identical lows strengthens the case for this zone acting as a major accumulation region.
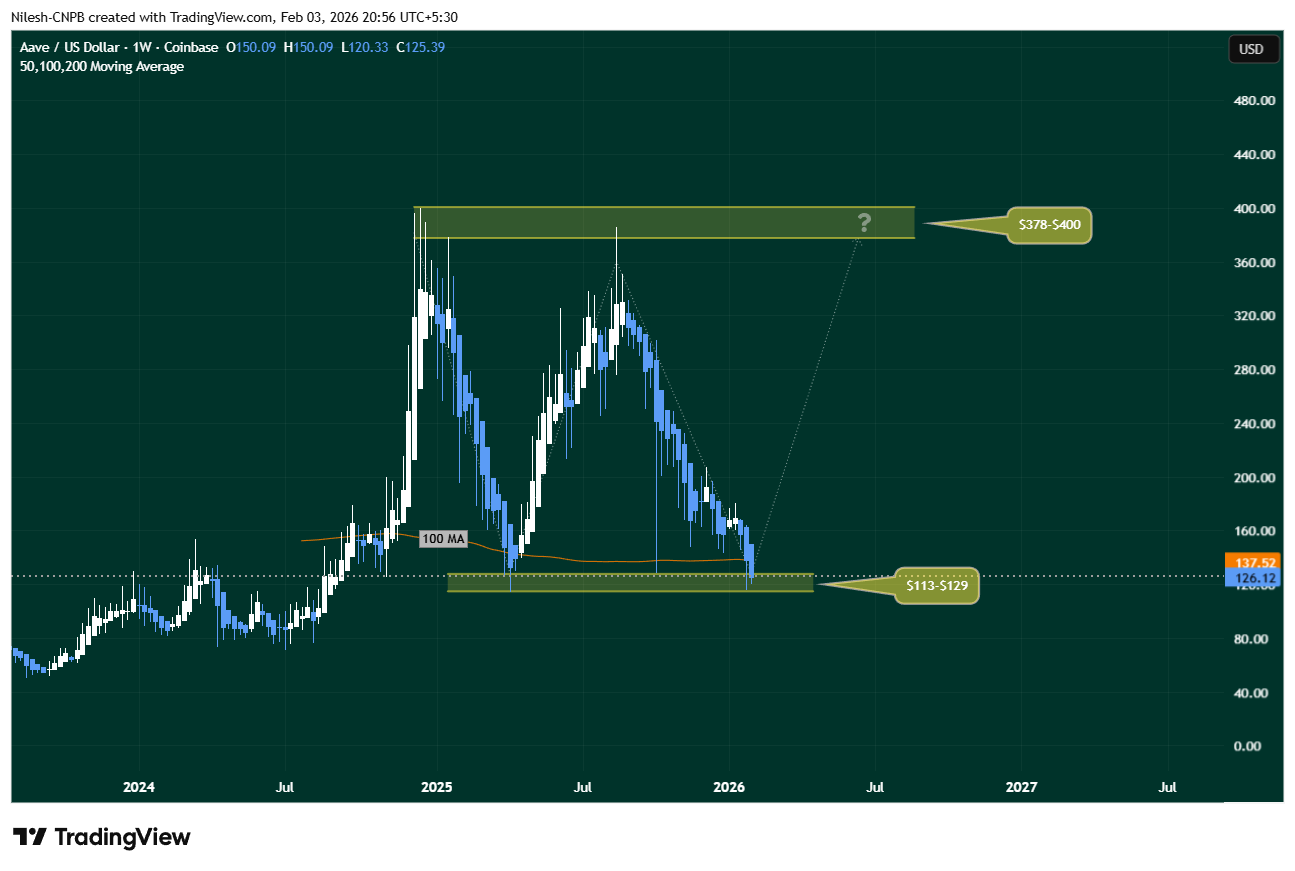
Aave ($AAVE) Weekly Chart/Coinsprobe (Source: Tradingview)
As long as AAVE continues to hold above this level, the broader double bottom structure remains technically valid.
What’s Next for AAVE?
For the bullish setup to gain traction, AAVE must hold the $113–$129 support zone and reclaim the 100-week moving average, currently sitting near $137.52. A sustained move above this level would signal improving momentum and mark an important shift in market structure.
If buyers manage to push price higher from here, the next major upside objective would be the neckline resistance at $378–$400. While that target may appear distant, a successful double bottom confirmation often leads to sharp recovery moves — especially if broader market conditions stabilize.
On the downside, the $113–$129 region remains the line in the sand. A decisive breakdown below this zone would invalidate the bullish setup and open the door to deeper downside risk.
Final Outlook
Despite recent weakness, AAVE’s technical structure remains constructive. The repeated defense of key support, the developing double bottom formation, and price hovering near the 100-week moving average suggest the token may be approaching a pivotal inflection point.
If accumulation continues and broader crypto sentiment improves, AAVE could be setting the stage for a meaningful recovery phase. Until then, all eyes remain on how price behaves around this critical support zone.
Disclaimer: The views and analysis presented in this article are for informational purposes only and reflect the author’s perspective, not financial advice. Technical patterns and indicators discussed are subject to market volatility and may or may not yield the anticipated results. Investors are advised to exercise caution, conduct independent research, and make decisions aligned with their individual risk tolerance.
About Author: Nilesh Hembade is the Founder and Lead Author of Coinsprobe, with over 5 years of experience in the cryptocurrency and blockchain industry. Since launching Coinsprobe in 2023, he has been providing daily, research-driven insights through in-depth market analysis, on-chain data, and technical research.
Disclaimer: The information on this page may come from third parties and does not represent the views or opinions of Gate. The content displayed on this page is for reference only and does not constitute any financial, investment, or legal advice. Gate does not guarantee the accuracy or completeness of the information and shall not be liable for any losses arising from the use of this information. Virtual asset investments carry high risks and are subject to significant price volatility. You may lose all of your invested principal. Please fully understand the relevant risks and make prudent decisions based on your own financial situation and risk tolerance. For details, please refer to
Disclaimer.
Related Articles
Solana Charts Flash SMC Distribution Warning at $74 and $50
_Solana SMC distribution setup targets $74.11 and $50.18 as two analysts flag a deepening correction with $70 as the critical line_
Two crypto analysts are flagging the same bearish structure on Solana’s chart. The timing is not coincidental. The levels they are pointing to, $74.11 and $50.18
LiveBTCNews7m ago
Grayness Report: Zcash is "Severely Undervalued" by the Market! AI Monitoring Boosts Privacy Demand, and ZEC Could Become the Preferred Choice for Digital Cash
An asset management firm’s Grayscale report points out that the value of financial privacy is being underestimated under the influence of AI technology, and that Zcash (ZEC), with its zero-knowledge proof technology, has become a key alternative in digital finance. Although its current market share is only 0.3%, future privacy demand is expected to bring significant upside potential. However, regulatory risks and technical challenges still need to be taken into account.
動區BlockTempo13m ago
3 Crypto Coins With 40%+ Upside—Are You In or Out?
Avalanche shows strong accumulation and network growth, signaling potential breakout above resistance.
Bitcoin Cash gains momentum with rising transactions and higher lows, supporting bullish continuation.
Cardano builds stability through development, with consolidation hinting at a
CryptoNewsLand22m ago
BTC 15-minute drop of 0.54%: Weak liquidity and whale sell pressure jointly drive the decline
2026-03-30 14:15 to 14:30 (UTC) saw a significant abnormal move in the Bitcoin spot market. The short-term return rate was -0.54%, the price ranged from 67249.9 to 67698.6 USDT, and the amplitude reached 0.66%. Overall, trading volume and depth remain at extremely low levels within the year, which has increased volatility. Market attention has risen, and investors’ risk-avoidance sentiment has warmed.
The main drivers of this abnormal move are fragile liquidity and concentrated whale fund selling. Specifically, spot trading volume has fallen to its lowest level since November 2023, and the 1% market depth has broken below 0.5%, indicating a significant reduction in market liquidity and increased risk of further sharp declines.
GateNews26m ago
Grayscale: Zcash’s Upside Potential Depends on the Repricing of Financial Privacy in an AI-Driven World
Grayscale analyst Michael Zhao’s report notes that AI monitoring and on-chain transparency could make privacy features a core financial requirement, yet the crypto market’s valuation of this is currently too low. Zcash’s shielded transactions show that privacy demand is real, but its market share is only about 0.3%. If market expectations shift, ZEC could have a much larger upside potential; the current quote is about $224.80.
GateNews26m ago
Zcash upside hinges on repricing financial privacy in an AI-driven world, Grayscale says
Grayscale believes Zcash (ZEC), a privacy-centric cryptocurrency, is undervalued due to increasing demand for financial privacy amid AI surveillance. Its usage and investment are growing, though regulatory uncertainties and market volatility pose risks.
CoinDesk36m ago
