
Key Takeaways
-
SUI has dropped nearly 67% from its recent peak, placing it in a potential bottoming zone.
-
Current price action closely mirrors Solana’s 2025 bottoming fractal, which preceded a strong reversal.
-
A reclaim of the 50-day moving average could confirm a trend shift and open the door for a broader recovery.
SUI, the native token of Sui’s Layer-1 blockchain, has struggled to live up to its early hype in recent months, especially when compared to** Solana’s (SOL)** 2021 explosive performance. A broader market correction has only added pressure, dragging SUI nearly 50% lower over the past 90 days.
But zooming out and looking beneath the surface, the current price structure tells a more interesting story. On the charts, SUI is starting to resemble a bottoming fractal previously seen in Solana—a setup that eventually led to a sharp and sustained upside move.
Source: Coinmarketcap
SUI Mirrors SOL’s Bottoming Path
A side-by-side comparison of SUI and SOL reveals striking similarities.
Back in early 2025, **Solana **topped near $295 before entering a sharp corrective phase. Price slipped below the 50-day moving average, signaling weakening momentum. The sell-off eventually stretched into a deep 67% drawdown, flushing out late longs and marking a clear sentiment reset.
That low proved pivotal.
Once SOL reclaimed its 50-day moving average, the trend structure flipped. What followed was a 163% rally, one of the most notable reversals of 2025.
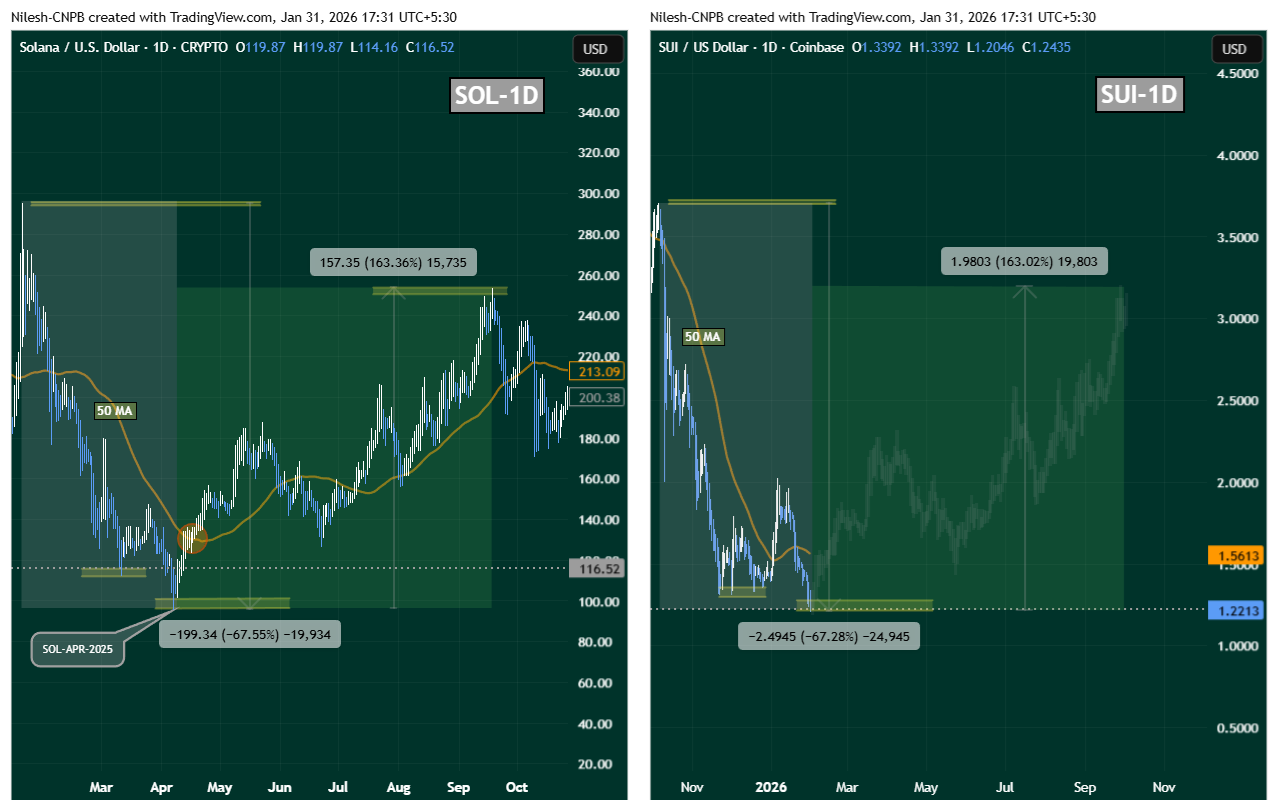
SOL and SUI Fractal Chart/Coinsprobe (Source: Tradingview)
SUI now appears to be following a similar script.
After peaking around $3.70 in October 2025, SUI entered a steep correction, losing its 50-day moving average and sliding into a nearly identical 67% drawdown. Momentum faded, volatility compressed, and price action began to flatten—classic characteristics of a market searching for a base.
What’s Next for SUI?
From a technical perspective, SUI is now sitting near a critical inflection zone around $1.20–$1.22, an area that could act as a potential bottom if buyers continue to defend it.
The first major confirmation bulls will want to see is a reclaim of the 50-day moving average, currently hovering near $1.56. A sustained move above this level would signal that bearish momentum is fading and that buyers are regaining control.
If that reclaim occurs, SUI could transition into a broader recovery phase. In a scenario where the SOL fractal continues to play out, upside expansion toward the $3.00–$3.20 region would come back into focus over the medium term.
Key Risk Note
While fractal comparisons can offer valuable context, they are not guarantees. Each asset trades within its own liquidity environment, sentiment cycle, and macro backdrop. For SUI, confirmation still matters—especially through moving average reclaims and consistent follow-through buying.
Until then, the structure suggests risk is compressing, not expanding.
Disclaimer: The views and analysis presented in this article are for informational purposes only and reflect the author’s perspective, not financial advice. Technical patterns and indicators discussed are subject to market volatility and may or may not yield the anticipated results. Investors are advised to exercise caution, conduct independent research, and make decisions aligned with their individual risk tolerance.
About Author: Nilesh Hembade is the Founder and Lead Author of Coinsprobe, with over 5 years of experience in the cryptocurrency and blockchain industry. Since launching Coinsprobe in 2023, he has been providing daily, research-driven insights through in-depth market analysis, on-chain data, and technical research.
Disclaimer: The information on this page may come from third parties and does not represent the views or opinions of Gate. The content displayed on this page is for reference only and does not constitute any financial, investment, or legal advice. Gate does not guarantee the accuracy or completeness of the information and shall not be liable for any losses arising from the use of this information. Virtual asset investments carry high risks and are subject to significant price volatility. You may lose all of your invested principal. Please fully understand the relevant risks and make prudent decisions based on your own financial situation and risk tolerance. For details, please refer to
Disclaimer.
Related Articles
Robert Kiyosaki warns of the risk of market collapse, prioritizing Bitcoin and real assets.
Robert Kiyosaki advocates for long-term investment in non-inflatable assets like oil, real estate, and cryptocurrencies amid market downturn concerns. He focuses on accumulating tangible assets, aiming to prosper during economic crises, and has recently resumed buying before a predicted market collapse in 2026.
TapChiBitcoin13m ago
Glassnode: The accumulation structure for Bitcoin between $60,000 and $70,000 is taking shape, but the strength is far less than the previous highs.
According to Glassnode's report, the cost basis for short-term Bitcoin holders is at the lower range of $60,000-$70,000, indicating accumulation signals, but the strength is still insufficient. BTC has accumulated over 429,000 in this range, and this area is considered a high-confidence support zone. The options market indicates that short-term volatility may intensify.
動區BlockTempo26m ago
Should investors buy TAO right now or wait for the price to drop below $300?
Bittensor (TAO) remains resilient above the psychological level of $300, contrasting with the declines of Bitcoin and Ethereum. A confirmed bullish structure and rising demand for decentralized AI infrastructure support its strength, though a potential correction may offer buying opportunities.
TapChiBitcoin47m ago
PEPE Whales Move $20.7M—Is a Breakout or Breakdown Next?
PEPE whales withdrew $20.7M PEPE, reducing supply and easing sell pressure.
Price holds support, with compression building below key resistance level.
Rising OI and positive funding signal growing bullish momentum and breakout potential.
PepeCoin — PEPE, recently flashed a signal that
CryptoNewsLand1h ago
Bitcoin ETF ends seven consecutive days of gains, Bitcoin price pressure reappears.
Recently, after a continuous net inflow into the U.S. Bitcoin spot ETF for seven trading days, a significant outflow occurred, with a net outflow of $163.5 million on the 18th and another outflow of $51.9 million on the 19th, indicating a simultaneous weakening of market funds and prices. Bitcoin's price briefly fell below $70,000, highlighting that the fund flows from the ETF can no longer support its rebound, and the deteriorating macro environment is putting pressure on risk assets, leading to a noticeable contraction in investor preferences. The testing of the $70,000 level has become a barometer for short-term market sentiment.
区块客1h ago
The RWA Yield Infrastructure Trade
The essay highlights challenges in direct RWA token exposure, emphasizes the potential in leverage opportunities amid settlement delays, critiques Morpho's governance token structure, and presents Fluid as a more effective token model with stablecoin links.
CoinDesk1h ago
