
Key Takeaways
-
ZEC is holding a major support zone between $300–$335 after a 30% monthly correction.
-
A descending triangle pattern is forming on the daily chart.
-
A breakout above $411 could signal the start of a renewed bullish move.
Zcash (ZEC) is showing early signs of stabilization after a sharp corrective phase. As of January 26, 2026, ZEC is trading near the $360 level, posting a 4% gain over the past 24 hours. This bounce comes after a steep 30% decline over the last month, which followed ZEC’s explosive 2025 rally, where the privacy-focused cryptocurrency surged more than 800% at its peak, reaching levels near $750.
While broader market conditions remain volatile, ZEC’s latest price action suggests that the asset may be approaching a decisive moment — one that could determine whether bulls regain control or bears extend the correction.
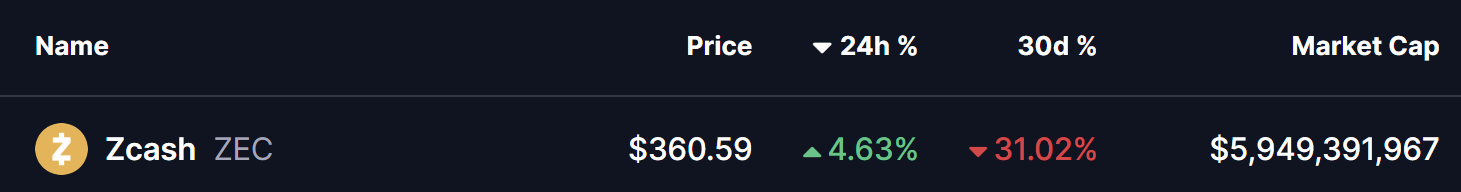
Source: Coinmarketcap
Descending Triangle Takes Shape on the Daily Chart
From a technical perspective, Zcash’s daily chart reveals a well-defined descending triangle pattern, a structure that typically forms after a strong uptrend and often precedes a major directional move.
This pattern is characterized by two key elements:
-
A horizontal support zone between $300 and $335, which has consistently attracted buyers during recent pullbacks.
-
A sequence of lower highs, creating a downward-sloping resistance line originating from the 2025 peak near $750.
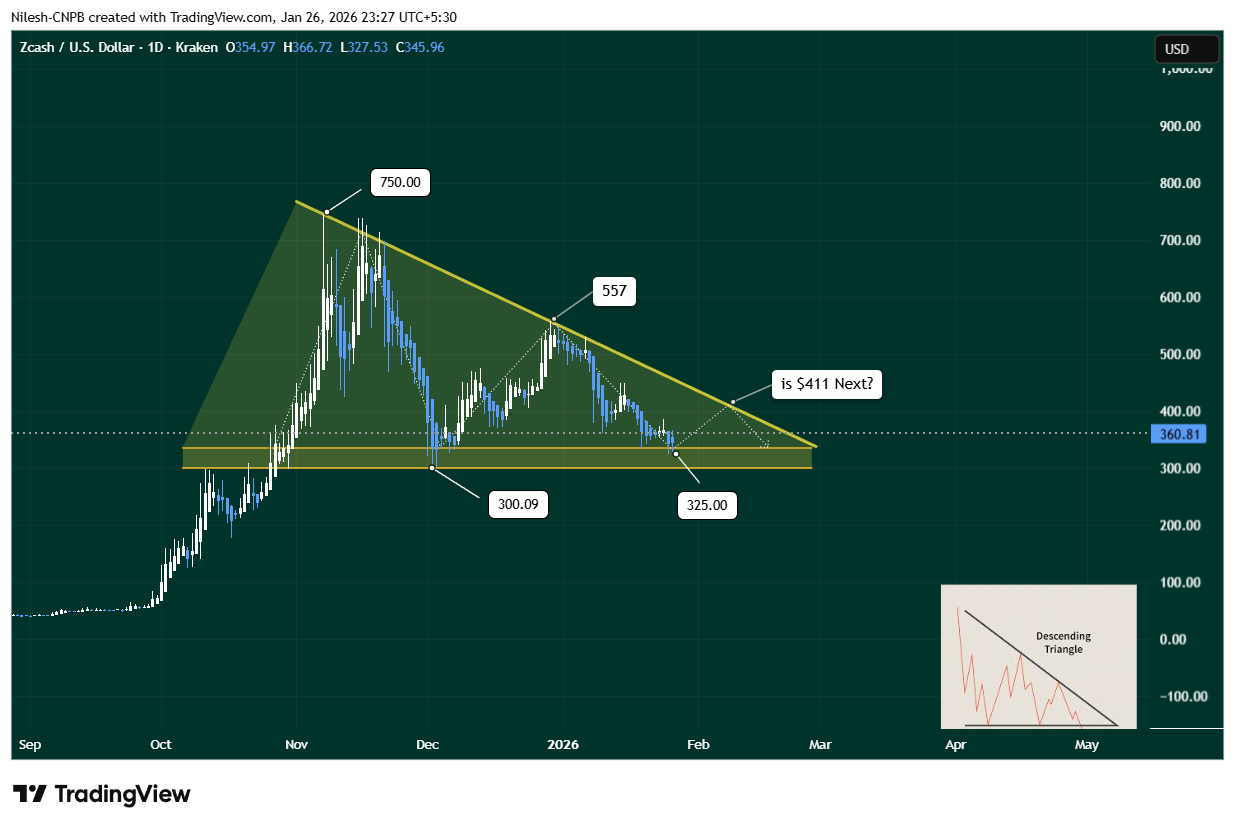
Zcash (ZEC) Daily Chart/Coinsprobe (Source: Tradingview)
During the most recent leg of the correction, ZEC dipped into the lower boundary of this support zone, finding demand near $325. Buyers stepped in aggressively at this level, triggering a rebound that lifted price back toward the $360 area. This reaction suggests that bulls are actively defending the structure and are not yet willing to concede control.
The repeated defense of the $300–$335 region highlights its importance as a critical accumulation zone. As long as ZEC continues to trade above this range, the broader technical structure remains intact.
What’s Next for ZEC?
Looking ahead, If ZEC continues to sustain above the support trendline, the next logical move would be a retest of the descending resistance near $411.
-
Bullish Scenario:
If ZEC holds above support and breaks above the $411 resistance with strong volume, it could invalidate the bearish implications of the descending triangle and mark the beginning of a new bullish expansion phase.
-
Bearish Scenario:
Failure to break resistance — or a loss of the $300–$335 support zone — could send ZEC back into consolidation or trigger another retest of lower demand levels before a clear trend emerges.
Final Outlook
Zcash is currently at a technical inflection point. The combination of strong historical support, a tightening price structure, and an early rebound off key demand levels suggests that a larger move may be approaching. Whether that move resolves higher toward $411 or lower back into support will depend on how price reacts as the descending triangle nears its apex.
For now, $325 support and $411 resistance remain the two most important levels to monitor.
Disclaimer: The views and analysis presented in this article are for informational purposes only and reflect the author’s perspective, not financial advice. Technical patterns and indicators discussed are subject to market volatility and may or may not yield the anticipated results. Investors are advised to exercise caution, conduct independent research, and make decisions aligned with their individual risk tolerance.
About Author: Nilesh Hembade is the Founder and Lead Author of Coinsprobe, with over 5 years of experience in the cryptocurrency and blockchain industry. Since launching Coinsprobe in 2023, he has been providing daily, research-driven insights through in-depth market analysis, on-chain data, and technical research.
Disclaimer: The information on this page may come from third parties and does not represent the views or opinions of Gate. The content displayed on this page is for reference only and does not constitute any financial, investment, or legal advice. Gate does not guarantee the accuracy or completeness of the information and shall not be liable for any losses arising from the use of this information. Virtual asset investments carry high risks and are subject to significant price volatility. You may lose all of your invested principal. Please fully understand the relevant risks and make prudent decisions based on your own financial situation and risk tolerance. For details, please refer to
Disclaimer.
Related Articles
Glassnode: About 80% of Bitcoin is held by long-term holders; it’s a bear market or nearing the bottom, but more months of sideways trading are still needed
Bitcoin's bear market has lasted for nearly six months. The market may be entering a "time pain" phase, with long-term holders making up about 80% of the supply. Glassnode believes the bear market is nearing the bottom, but it still needs several months of sideways consolidation.
GateNews12m ago
BTC whale proxy Garrett Jin: Trump’s remarks are political spin; the escalation of the conflict in the Middle East is irreversible
BTC OG insider mega-whale agent Garrett Jin analyzes President Trump’s speech, saying it suggests a commitment to a hot war, and that the escalation of the Middle East conflict is already set in stone. He notes that the market hasn’t priced this in, that the near-term rebound is driven by positioning, and that the absence of any solution to the war will continue to weigh on oil supply and raise risks for importing countries. A 6% jump in oil prices reflects the reality of the conflict escalating.
GateNews43m ago
PEPE Chart Flashes Buy Signal: 50% Breakout in the Making?
The frog-themed meme coin PEPE, once part of the elite club of the 20 biggest cryptocurrencies, has lately been a pale shadow of its former success.
While its price has collapsed by 55% over the past year, one important indicator suggests a substantial rebound could soon make the bulls happy.
A
CryptoPotato1h ago
Shiba Inu Price Stuck: Bullish Signal Appears, But SHIB Refuses To Move
Shiba Inu price is entering a moment that often appears right before major moves, yet the current structure does not offer a clear direction. The chart shows tightening volatility, which usually comes before expansion. At the same time, momentum indicators
CaptainAltcoin1h ago
Trump Promises a Ceasefire in “2 to 3 Weeks”! Bitcoin Surges Past $69,000, With the “Top 3 Positive Catalysts” Taking the Stage
The Middle East situation has taken a turn, with U.S. President Trump predicting that the U.S.-Iran conflict will be over within 2 to 3 weeks, driving a rebound in global markets. Asian stocks surged to their strongest gains in months, and both the U.S. stock market and the cryptocurrency market also rose. Iran has signaled a willingness to end the conflict; if the UAE were to join the fighting, it could affect oil prices. As market confidence rises, the issuance of crypto ETFs is expected to bring in new capital, further boosting the market outlook.
区块客2h ago
Crypto Market Drops As Fear Grows and Major Assets Decline
The crypto market faces a downturn with a 2.53% drop in market capitalization, led by decreases in Bitcoin and Ethereum prices. However, daily crypto volume rose by 4.26%, while NFT sales surged. Key developments include Genius Group repaying debt and Australia's new crypto policy approval.
BlockChainReporter3h ago
