
Key Takeaways
-
SUI has dropped nearly 67% from its recent peak, placing it in a potential bottoming zone.
-
Current price action closely mirrors Solana’s 2025 bottoming fractal, which preceded a strong reversal.
-
A reclaim of the 50-day moving average could confirm a trend shift and open the door for a broader recovery.
SUI, the native token of Sui’s Layer-1 blockchain, has struggled to live up to its early hype in recent months, especially when compared to** Solana’s (SOL)** 2021 explosive performance. A broader market correction has only added pressure, dragging SUI nearly 50% lower over the past 90 days.
But zooming out and looking beneath the surface, the current price structure tells a more interesting story. On the charts, SUI is starting to resemble a bottoming fractal previously seen in Solana—a setup that eventually led to a sharp and sustained upside move.
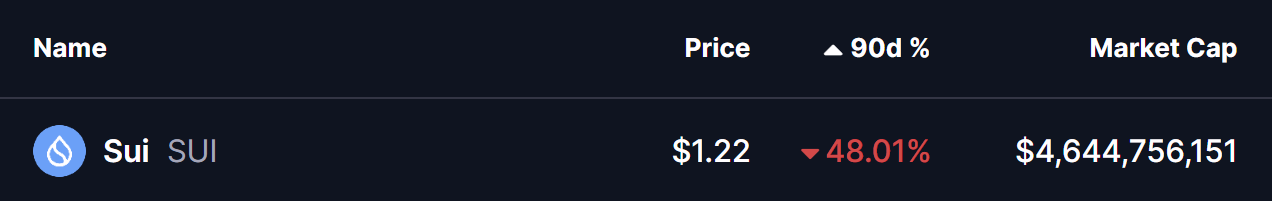
Source: Coinmarketcap
SUI Mirrors SOL’s Bottoming Path
A side-by-side comparison of SUI and SOL reveals striking similarities.
Back in early 2025, **Solana **topped near $295 before entering a sharp corrective phase. Price slipped below the 50-day moving average, signaling weakening momentum. The sell-off eventually stretched into a deep 67% drawdown, flushing out late longs and marking a clear sentiment reset.
That low proved pivotal.
Once SOL reclaimed its 50-day moving average, the trend structure flipped. What followed was a 163% rally, one of the most notable reversals of 2025.
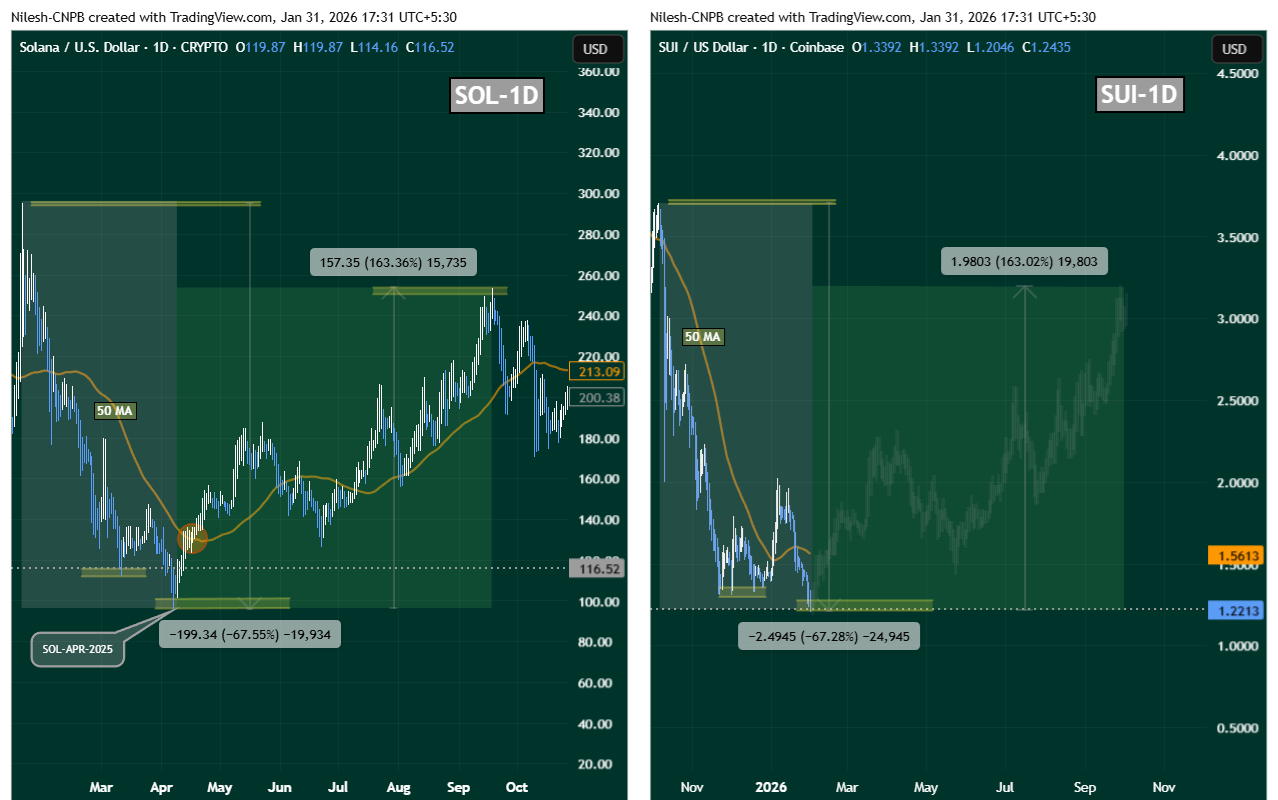
SOL and SUI Fractal Chart/Coinsprobe (Source: Tradingview)
SUI now appears to be following a similar script.
After peaking around $3.70 in October 2025, SUI entered a steep correction, losing its 50-day moving average and sliding into a nearly identical 67% drawdown. Momentum faded, volatility compressed, and price action began to flatten—classic characteristics of a market searching for a base.
What’s Next for SUI?
From a technical perspective, SUI is now sitting near a critical inflection zone around $1.20–$1.22, an area that could act as a potential bottom if buyers continue to defend it.
The first major confirmation bulls will want to see is a reclaim of the 50-day moving average, currently hovering near $1.56. A sustained move above this level would signal that bearish momentum is fading and that buyers are regaining control.
If that reclaim occurs, SUI could transition into a broader recovery phase. In a scenario where the SOL fractal continues to play out, upside expansion toward the $3.00–$3.20 region would come back into focus over the medium term.
Key Risk Note
While fractal comparisons can offer valuable context, they are not guarantees. Each asset trades within its own liquidity environment, sentiment cycle, and macro backdrop. For SUI, confirmation still matters—especially through moving average reclaims and consistent follow-through buying.
Until then, the structure suggests risk is compressing, not expanding.
Disclaimer: The views and analysis presented in this article are for informational purposes only and reflect the author’s perspective, not financial advice. Technical patterns and indicators discussed are subject to market volatility and may or may not yield the anticipated results. Investors are advised to exercise caution, conduct independent research, and make decisions aligned with their individual risk tolerance.
About Author: Nilesh Hembade is the Founder and Lead Author of Coinsprobe, with over 5 years of experience in the cryptocurrency and blockchain industry. Since launching Coinsprobe in 2023, he has been providing daily, research-driven insights through in-depth market analysis, on-chain data, and technical research.
Disclaimer: The information on this page may come from third parties and does not represent the views or opinions of Gate. The content displayed on this page is for reference only and does not constitute any financial, investment, or legal advice. Gate does not guarantee the accuracy or completeness of the information and shall not be liable for any losses arising from the use of this information. Virtual asset investments carry high risks and are subject to significant price volatility. You may lose all of your invested principal. Please fully understand the relevant risks and make prudent decisions based on your own financial situation and risk tolerance. For details, please refer to
Disclaimer.
Related Articles
The next big Bitcoin shock could be when Wall Street loses confidence and starts selling
Bitcoin's recent drop below $67,000 marks a significant correction, but unlike past declines, market reactions are noticeably calmer. The endurance of the Bitcoin spot ETF in the U.S. suggests that new holders exhibit greater patience. Despite fluctuations and macroeconomic influences, a mass sell-off hasn't occurred, indicating a shift in investor behavior that may define Bitcoin's future cycles.
TapChiBitcoin5m ago
AAVE loses a pivotal support level: What scenario for the $92 threshold?
Aave's price has fallen below the crucial $100 support level amid a weakening market, reaching a three-week low of $96. Investor sentiment has turned bearish, leading to significant sell-offs and an increase in market pressure. Indicators suggest a continued downward trend unless AAVE can reclaim the $100 mark.
TapChiBitcoin13m ago
Where Could Kaspa (KAS) Price Be Headed This Week?
Kaspa (KAS) has been holding up better than most altcoins lately, even as the wider market struggles to find direction. A recent market-wide “golden cross” has put altcoins on watch for a possible breakout, and Kaspa is one of the names standing out with steady demand and higher lows.
Last
CaptainAltcoin20m ago
Crypto Market Holds Steady Despite U.S.-Iran Tensions
The crypto market remains stable amid geopolitical tensions, with a market cap of $2.31T. Bitcoin and Ethereum show slight gains, while notable gainers include TRUMP, IRIS, and PEPE. DeFi TVL rises, but NFT sales decline. Key companies adopt Solana's toolkit, and Singapore reports an $8.83M crypto theft.
BlockChainReporter46m ago
The mid-range trap of Solana – Here’s why traders should be cautious!
Solana (SOL) faces challenges after a Bitcoin surge, exhibiting mixed signals. Despite prior momentum, prices struggle to break resistance at $89.9. Current support is at $76.6-$89.9, with bearish indicators suggesting potential further declines despite possible short-term rebounds.
TapChiBitcoin1h ago
