
Key Takeaways
-
Hyperliquid (HYPE) surged over 8%, reclaiming the $23.30 level amid rising market interest.
-
DefiLlama data shows Hyperliquid leading perpetual futures volume over the last 30 days, topping $160 billion.
-
Strong derivatives activity suggests sustained trader demand and growing ecosystem traction.
-
The daily chart highlights a Bearish Shark harmonic pattern, allowing room for short-term upside.
Hyperliquid’s native token, HYPE, is back in the spotlight today after posting a 8%+ price jump, pushing above the $23.30 level. While the price move itself has caught traders’ attention, a deeper look at on-chain metrics and the daily chart suggests there may be more developing beneath the surface.
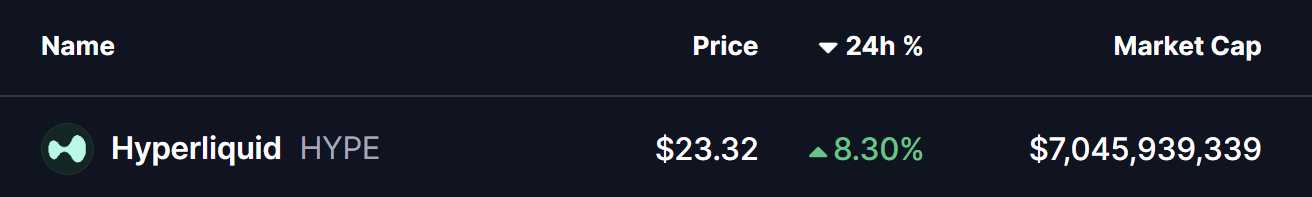
Source: Coinmarketcap
Hyperliquid (HYPE) Leads Perp Volume
According to DefiLlama data, **Hyperliquid **has emerged as the **top perpetual futures **platform by trading volume over the last 30 days, significantly outperforming its closest competitors. The protocol recorded approximately $160.4 billion in perpetual volume, comfortably ahead of Aster and Lighter, which logged around $124.7 billion and $112.5 billion, respectively.
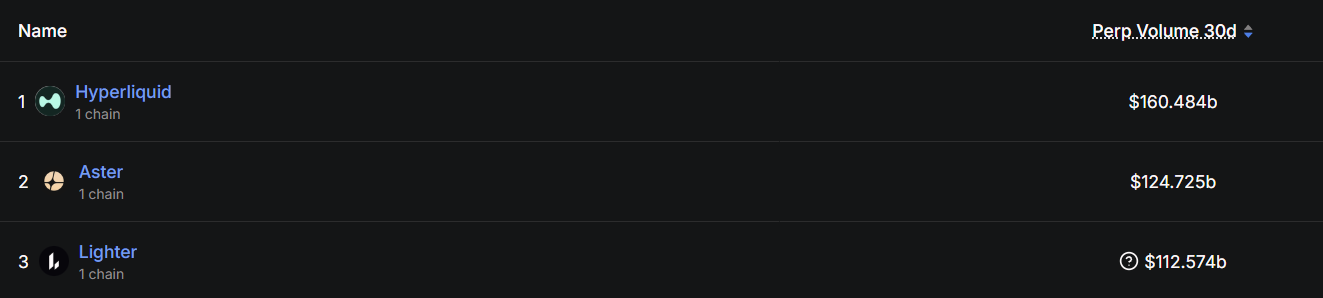
Source: Defillama
This surge in activity highlights growing trader preference for Hyperliquid’s ecosystem, signaling strong demand, deep liquidity, and sustained engagement. Historically, rising derivatives volume often acts as a leading indicator for increased interest in a project’s native token — something that appears to be playing out in HYPE’s recent price action.
Is More Upside Ahead?
From a technical perspective, HYPE’s daily chart reveals the development of a Bearish Shark harmonic pattern, a well-known formation in technical analysis. While this pattern ultimately suggests a potential reversal once fully completed, it often allows for short-term bullish continuation as price moves toward the “C” point.
Following the completion of the O-X-A-B structure, HYPE is currently trading around $23.26, holding above its recent lows. The next key challenge for bulls lies at the 50-day moving average near $25.72, which has acted as a dynamic resistance zone.
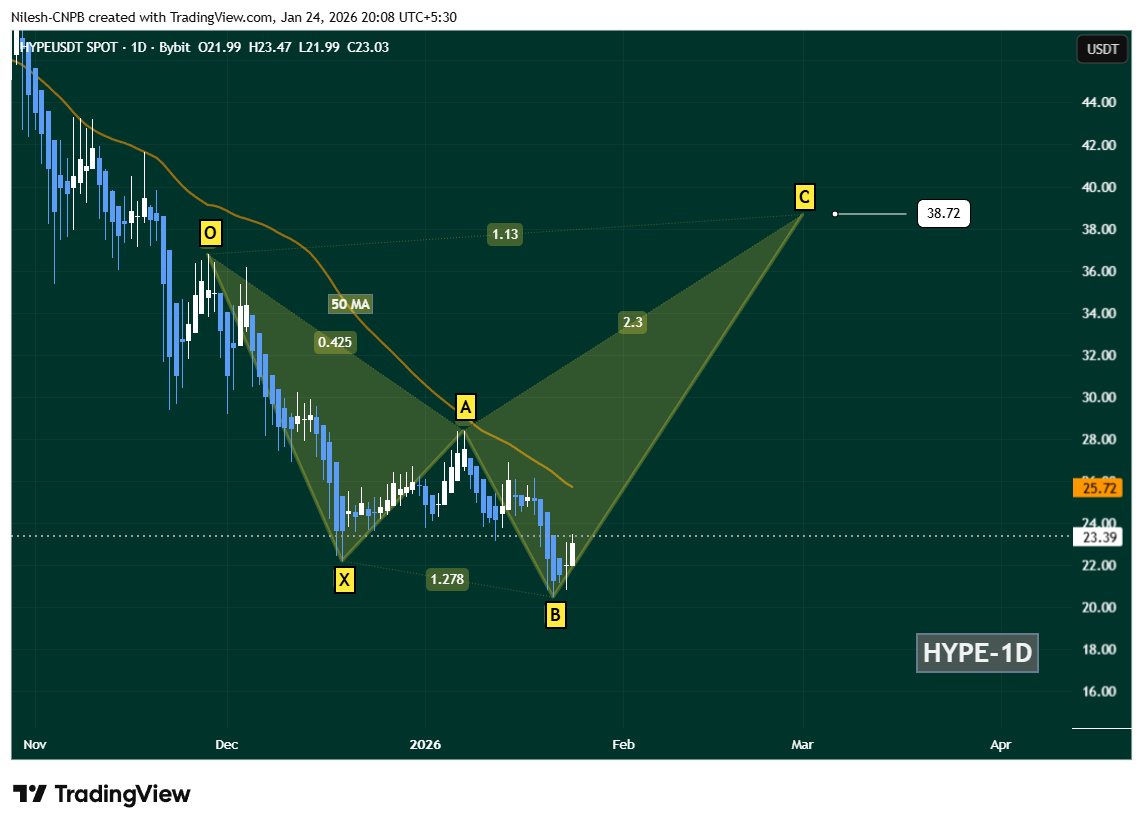
Hyperliquid (HYPE) Daily Chart/Coinsprobe (Source: Tradingview)
A decisive daily close above the 50-day MA ($25.72) would strengthen the recovery narrative and could open the door for a broader upside move. If momentum continues to build, the chart projects a potential advance toward the C-point near $38.72, aligning with the Shark pattern’s 1.13 Fibonacci extension.
However, downside risks remain. A failure to hold the B-point support zone would invalidate the bullish continuation setup and could expose HYPE to extended consolidation or further downside pressure in the near term.
Bottom Line
HYPE’s price rebound is being backed by strong on-chain fundamentals, with Hyperliquid clearly dominating the perpetual trading landscape. While the broader harmonic structure suggests caution in the longer term, short-term technicals still favor a recovery move as long as key support levels remain intact. All eyes now remain on the $25.72 reclaim, which could act as the trigger for the next leg higher.
Disclaimer: The views and analysis presented in this article are for informational purposes only and reflect the author’s perspective, not financial advice. Technical patterns and indicators discussed are subject to market volatility and may or may not yield the anticipated results. Investors are advised to exercise caution, conduct independent research, and make decisions aligned with their individual risk tolerance.
About Author: Nilesh Hembade is the Founder and Lead Author of Coinsprobe, with over 5 years of experience in the cryptocurrency and blockchain industry. Since launching Coinsprobe in 2023, he has been providing daily, research-driven insights through in-depth market analysis, on-chain data, and technical research.
Disclaimer: The information on this page may come from third parties and does not represent the views or opinions of Gate. The content displayed on this page is for reference only and does not constitute any financial, investment, or legal advice. Gate does not guarantee the accuracy or completeness of the information and shall not be liable for any losses arising from the use of this information. Virtual asset investments carry high risks and are subject to significant price volatility. You may lose all of your invested principal. Please fully understand the relevant risks and make prudent decisions based on your own financial situation and risk tolerance. For details, please refer to
Disclaimer.
Related Articles
Bitcoin falls below 71,500 USD, U.S.-Iran talks remain deadlocked, and the Strait of Hormuz becomes the biggest point of contention
On April 11, the U.S. and Iran began 20 hours of negotiations in Pakistan. The core issue was freedom of passage through the Strait of Hormuz. After Bitcoin briefly rose to $73,800, it quickly fell back to $71,557. The U.S. side took a hardline stance, demanding that Iran open the strait, while Iran insisted that easing restrictions must wait until a comprehensive agreement is reached. The two sides have not yet reached a consensus.
動區BlockTempo14m ago
Crypto Market Maintains Steady Growth Trajectory As Top Assets Show Gains
The crypto market continues to grow, with a market cap of $2.44T and Bitcoin and Ethereum showing slight increases. Top gainers include $GPM and $BASE. Meanwhile, DeFi TVL declined, NFT sales rose, and notable developments include a trader's significant loss and a push for regulatory clarity in Congress.
BlockChainReporter1h ago
BTC 15-minute chart slightly down 0.57%: leveraged long positions passively cut risk and macro sentiment disturbances drive volatility
2026-04-12 12:45 to 13:00 (UTC), the BTC price range was 71081.7 to 71493.2 USDT, with an amplitude of 0.58%. Within 15 minutes, the return recorded was -0.57%. During the period of unusual activity, market volatility increased somewhat, risk sentiment warmed up, and overall attention rose; however, there was no extreme surge in volume or a sudden drop in liquidity.
The main driver behind this unusual activity is that, under the leverage structure, long positions were reduced passively. Recently, the funding rate for perpetual contracts turned from negative to positive. Leverage among longs in the market accumulated; the price dipped slightly, triggering liquidations of some leveraged long positions and sell orders for position closures, resulting in
GateNews3h ago
Analyst: Bitcoin’s current pullback is relatively mild compared with past ones, but the bottom has not been confirmed yet.
Crypto analyst Axel Adler Jr said the current Bitcoin pullback is smaller than historic bearish-market levels, but a bottom has not yet been confirmed. He believes the market is still in a mild bear phase, and that a true recovery will require patience and waiting.
GateNews4h ago
Bitcoin long-term holdings increased to 12.4 million coins, and the 30-day change has remained positive.
CryptoQuant analyst Darkfost says the Bitcoin market is entering an early stabilization phase, with stronger long-term holding behavior. The amount of BTC held for more than a year has increased, and investors are more inclined to hold than to distribute. This suggests the market is transitioning toward long-term conviction; the current trend is viewed as an early stability signal, but it needs longer-term confirmation.
GateNews6h ago
XRP Payments Fall 77% as Price Eyes End to Rally - U.Today
XRP's on-chain payment volume has dropped 77% to 86 million, signaling bearish momentum as its price stagnates below $1.35. This decline has raised investor concerns about potential volatility in the crypto market.
UToday8h ago
