
Key Takeaways
-
Avalanche (AVAX) has dropped over 16% in the past week, reflecting broader market weakness.
-
The 4H chart shows a Bullish Shark harmonic pattern, often associated with trend reversals.
-
Price is currently hovering near the $11.88 support, a critical zone for pattern validation.
-
If support holds, AVAX could rebound toward $13.39, with a higher upside target near $14.94.
-
A breakdown below the current support would invalidate the bullish setup and extend downside risk.
The cryptocurrency market remains under notable selling pressure as the total crypto market capitalization slipped 1.79% over the past 24 hours. This broader pullback triggered heightened volatility across digital assets, leading to more than $807 million in liquidations, with long positions bearing the brunt of the losses.
This wave of downside pressure has spilled into major altcoins, including Avalanche (AVAX). The token is trading slightly in the red and has dropped over 16% in the past seven days. However, beyond the red candles, AVAX’s chart is beginning to reveal a technical structure that suggests downside momentum may be weakening — and a rebound could be forming.
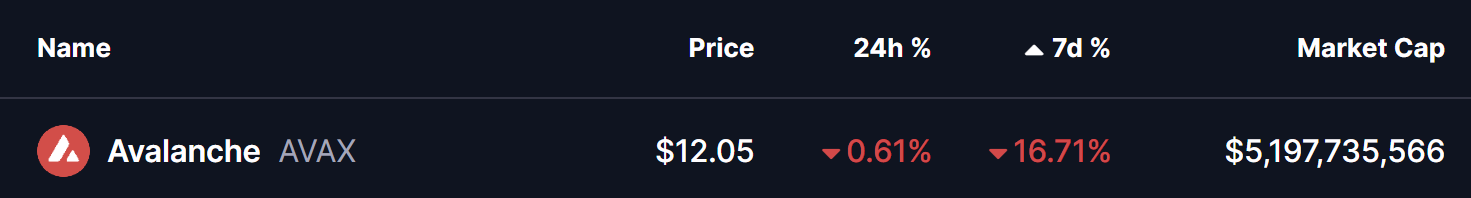
Source: Coinmarketcap
Harmonic Pattern Hints at Potential Upside
On the 4-hour timeframe, AVAX appears to be completing a Bullish Shark harmonic pattern, a formation that often emerges near market lows when selling pressure becomes exhausted. This pattern typically signals a potential trend reversal once its final leg forms within a defined demand zone.
The structure began with the initial O–X impulse around the $12.22 area, followed by a sharp rally that peaked near $14.83 at point X. Price then retraced aggressively toward point A before making another push higher to form point B near $14.94. That move, however, failed to sustain, triggering the current corrective leg.
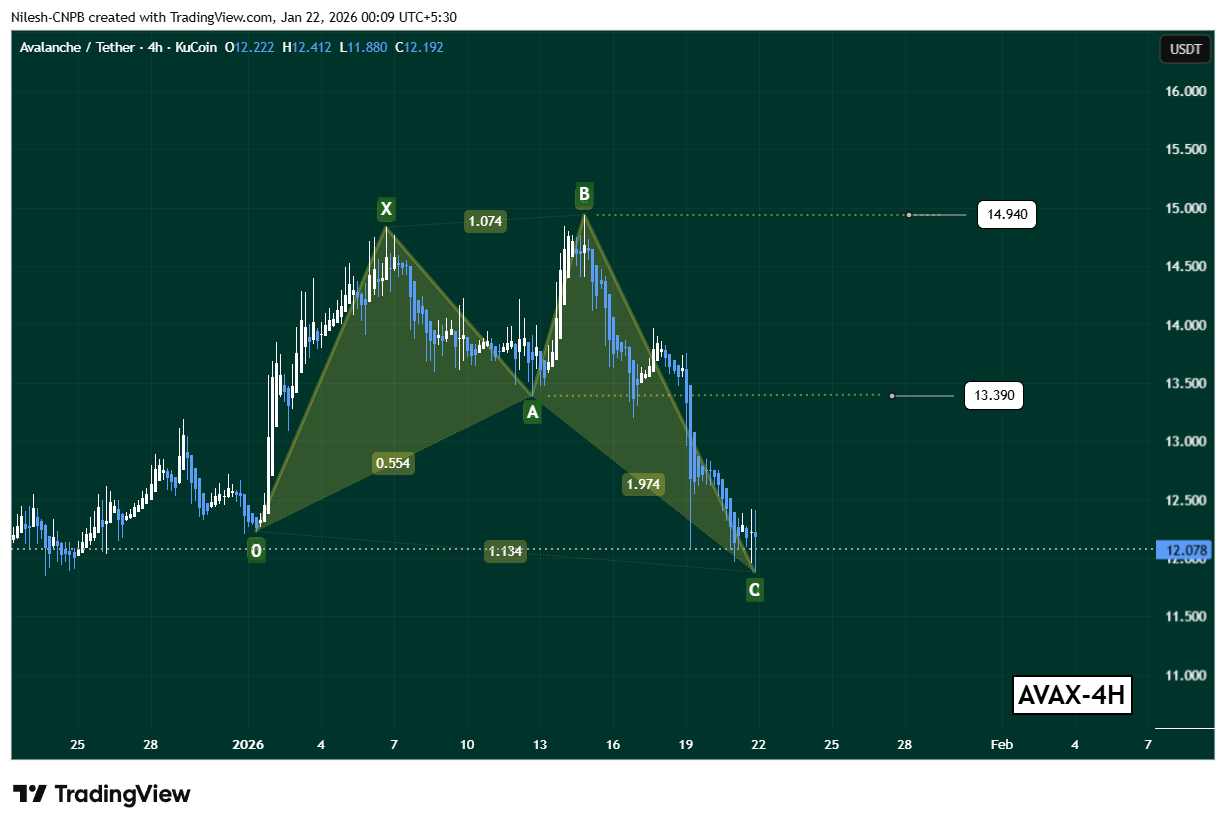
Avalanche (AVAX) 4H Chart/Coinsprobe (Source: Tradingview)
AVAX has since slid steadily lower, with price now hovering near $11.88, a level that could represent the C-point completion of the Shark pattern. This zone is technically important, as it’s where buyers often step in if the pattern is to play out bullishly.
What’s Next for AVAX?
If this harmonic structure continues to unfold as expected, AVAX could be positioning for a rebound from current levels. The first key upside level to watch sits around $13.39, which aligns closely with the prior A-point of the formation and serves as a near-term recovery target.
A stronger bullish follow-through could eventually bring the $14.94 region back into focus — the B-leg high and a significant resistance zone where sellers previously stepped in.
That said, the bullish outlook remains conditional. A sustained breakdown below the $11.88 support zone would invalidate the Shark pattern and shift momentum back in favor of the bears, opening the door for further downside continuation.
Bottom Line
AVAX may still be under pressure, but the emerging Bullish Shark harmonic pattern suggests selling momentum could be nearing exhaustion. As long as price holds above the current support zone, the setup favors a short-term rebound toward $13.39 and potentially $14.94. However, confirmation will depend on buyer response at current levels — making the next few sessions critical for Avalanche’s near-term direction.
Disclaimer: The views and analysis presented in this article are for informational purposes only and reflect the author’s perspective, not financial advice. Technical patterns and indicators discussed are subject to market volatility and may or may not yield the anticipated results. Investors are advised to exercise caution, conduct independent research, and make decisions aligned with their individual risk tolerance.
About Author: Nilesh Hembade is the Founder and Lead Author of Coinsprobe, with over 5 years of experience in the cryptocurrency and blockchain industry. Since launching Coinsprobe in 2023, he has been providing daily, research-driven insights through in-depth market analysis, on-chain data, and technical research.
Disclaimer: The information on this page may come from third parties and does not represent the views or opinions of Gate. The content displayed on this page is for reference only and does not constitute any financial, investment, or legal advice. Gate does not guarantee the accuracy or completeness of the information and shall not be liable for any losses arising from the use of this information. Virtual asset investments carry high risks and are subject to significant price volatility. You may lose all of your invested principal. Please fully understand the relevant risks and make prudent decisions based on your own financial situation and risk tolerance. For details, please refer to
Disclaimer.
Related Articles
BSC Chinese meme coins surge across the board, as CZ’s tweet sparks a “Crypto Summer” craze
On April 13, Chinese meme coins across the BSC chain rose across the board, led by “Binance Life,” with a weekly gain of up to 360% and an intraday increase of over 45%. CZ’s post sparked resonance with “Crypto Summer,” energizing sentiment across the entire sector. Although market sentiment has surged in the short term, the high volatility and liquidity risks of meme coins cannot be ignored, and investors need to be cautious.
MarketWhisper5m ago
Bittensor founder accuses former brother of betrayal; TAO’s sudden plunge sparks 9.1 million liquidations
Bittensor co-founder Jacob Steeves accuses Covenant AI’s Simon Dare of intentionally causing damage to the agreement, leading to a sharp drop in TAO tokens. Steeves proposes a locked-staking mechanism that uses on-chain code to enforce commitments and prevent founders from making sudden, surprise exits. Even as the crisis unfolds, Bittensor’s open-source architecture can still ensure the agreement continues to operate, and it is set to hold a meeting to introduce the new mechanism.
MarketWhisper49m ago
Bloomberg strategist Mike McGlone: a crypto bear market or at the early stage, with Bitcoin potentially falling back to $10k
Bloomberg strategist Mike McGlone says the crypto bear market may be in its early stages, and Bitcoin could fall to $10k. Even though Bitcoin ETFs have matched S&P 500 ETF returns, Bitcoin ETFs have higher volatility and the valuation of underlying assets that lack real support remains elevated.
GateNews1h ago
Why is Bitcoin down today? The U.S. military blocks the Strait of Hormuz, but Iran-U.S. talks end in failure
The U.S. imposes a naval blockade on Iran, causing the U.S.-Iran nuclear talks to fall apart. Market risk sentiment intensifies, and Bitcoin drops to $71,000, with a 24-hour decline of 3.1%. Traditional market capital flows into safe-haven assets, and analysts are divided on Bitcoin’s future trend, with $70,000 support acting as a key level.
MarketWhisper1h ago
The Crypto Fear and Greed Index drops to 12, and the market is in extreme fear
Gate News message, April 13. According to Alternative.me data, today the Crypto Fear and Greed Index is 12, down further from yesterday’s 16, with the market in an “extreme fear” state. This index evaluates market sentiment across multiple dimensions, including volatility, market trading volume, social media, market surveys, Bitcoin’s share of the overall market, and Google Trends keyword analysis. The lower the number, the greater the level of fear.
GateNews2h ago
ETH 15-minute drop of 0.66%: short-term holders selling off in tandem with exchange net inflows amplifies the selling pressure
2026-04-12 22:00 to 22:15 (UTC), ETH showed a clear downward move in a highly liquid environment. The candlestick chart indicates a return of -0.66%, with price fluctuations ranging from 2186.76 to 2211.25 USDT, and a swing amplitude of 1.11%. Market attention rose rapidly, short-term sentiment turned cautious, and volatility intensified.
The main driving factors behind this unusual move are a sharp increase in exchange net inflows and concentrated selling by short-term holders. On-chain data shows that over the past 24 hours, net inflow of ETH into exchanges totaled 9,567.65 ETH, suggesting that a large amount of capital entered the market in the short term, potentially increasing selling pressure.
GateNews4h ago
