
Key Takeaways
-
OriginTrail (TRAC) has surged around 12% in a single day, drawing renewed attention to the token.
-
TRAC has broken out from an ascending triangle near $0.46 on the daily chart, signaling growing bullish momentum.
-
Similar breakout structures in July and October 2025 previously led to strong rallies of 63% and 113%.
-
Holding the $0.44–$0.46 zone as support will be crucial to keep the bullish fractal setup intact.
-
If the pattern plays out, TRAC could attempt a move toward its long-term ascending resistance above $1.00.
OriginTrail, the decentralized knowledge graph protocol, is stepping back into the spotlight as its native token TRAC records a strong 12% daily surge. Beyond the price jump, the real signal is coming from the charts, where a familiar fractal breakout structure is starting to emerge on the daily timeframe, hinting that a larger upside move could be forming.
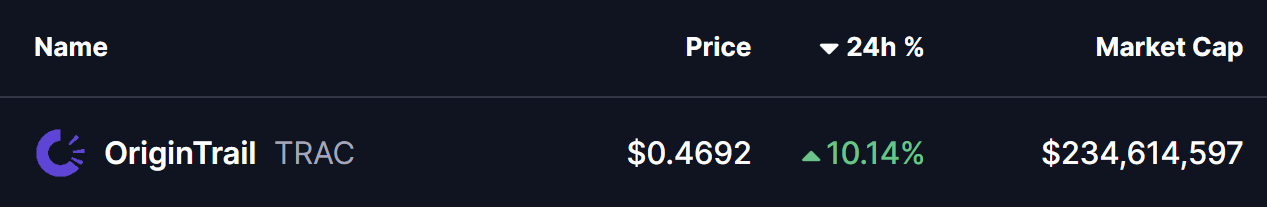
Source: Coinmarketcap
Fractal Breakout Hints at Potential Upside Move
On the daily chart, TRAC has confirmed a breakout from an ascending triangle pattern near the $0.46 level. This breakout is particularly important as price is now trading just above the 200-day moving average, a level that has historically acted as a major trend-defining zone for TRAC.
What makes this setup more compelling is its similarity to previous breakout phases. In late July 2025, a comparable structure resulted in a 63% upside move after price held above its breakout base. Later, in early October 2025, TRAC broke out from a right-angled descending broadening wedge pattern. That move was followed by a reclaim of the 200-day moving average and ultimately led to a powerful 113% rally.
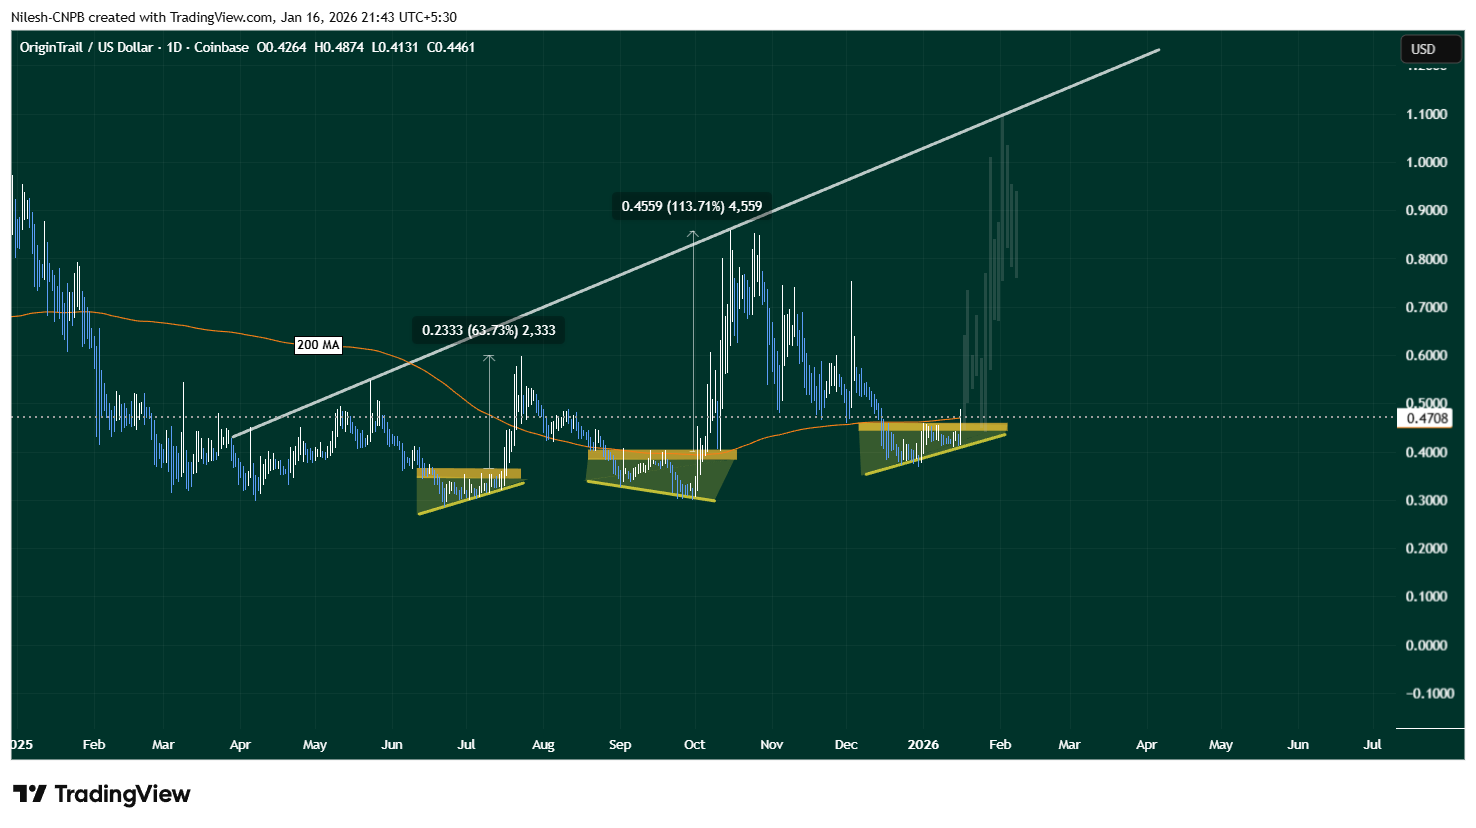
OriginTrail (TRAC) Daily Chart/Coinsprobe (Source: Tradingview)
The current setup shares key characteristics with those earlier moves. Price compression, a clean breakout, and interaction with the 200-day MA suggest that TRAC may once again be transitioning from consolidation into expansion.
What’s Next for TRAC?
If this fractal breakout plays out as expected, holding the $0.44–$0.46 zone as support will be crucial. A sustained hold above this range, along with continued strength above the 200-day moving average, could act as a launchpad for further upside.
In that scenario, TRAC may attempt a move toward its long-term ascending resistance trendline, which currently sits above the $1.00 level. A push toward that zone would align closely with the magnitude of prior fractal-driven rallies seen on the chart.
That said, fractal patterns are never guarantees. Broader market conditions, liquidity, and overall sentiment will continue to influence price action. A failure to hold the $0.44–$0.46 support zone or a rejection back below the 200-day moving average could invalidate the breakout and weaken the bullish fractal thesis.
Bottom Line
TRAC is showing early signs of another technically significant breakout, supported by historical fractal behavior and a reclaim of a key long-term moving average. If buyers can defend the current support zone, the chart suggests that OriginTrail may be positioning itself for a larger upside move in the weeks ahead.
Disclaimer: The views and analysis presented in this article are for informational purposes only and reflect the author’s perspective, not financial advice. Technical patterns and indicators discussed are subject to market volatility and may or may not yield the anticipated results. Investors are advised to exercise caution, conduct independent research, and make decisions aligned with their individual risk tolerance.
About Author: Nilesh Hembade is the Founder and Lead Author of Coinsprobe, with over 5 years of experience in the cryptocurrency and blockchain industry. Since launching Coinsprobe in 2023, he has been providing daily, research-driven insights through in-depth market analysis, on-chain data, and technical research.
Disclaimer: The information on this page may come from third parties and does not represent the views or opinions of Gate. The content displayed on this page is for reference only and does not constitute any financial, investment, or legal advice. Gate does not guarantee the accuracy or completeness of the information and shall not be liable for any losses arising from the use of this information. Virtual asset investments carry high risks and are subject to significant price volatility. You may lose all of your invested principal. Please fully understand the relevant risks and make prudent decisions based on your own financial situation and risk tolerance. For details, please refer to
Disclaimer.
Related Articles
96% of Pump Fun trading wallets earned under $500, with more than half losing money over the past month
Recent data shows that nearly 96% of wallets trading the Pump Fun token earned less than $0.01 last month, with over half reporting losses. Among them, 45.6% made minor profits, while some top wallets experienced significant gains or losses. Meanwhile, deployers benefitted substantially, earning $1 million from traders despite most tokens underperforming. The Pump Fun token has dropped 80% from its peak.
TapChiBitcoin4m ago
Bittensor (TAO) is facing a 4-month resistance level as the price surpasses the $300 mark
Bittensor (TAO) is currently trading around 330 USD, up 12.05% on the day and 19% for the week, while breaking above the 300 USD level for the first time since late November 2025. This upward momentum is pushing the price toward a key confluence resistance zone – an area that has repeatedly blocked recovery attempts over the past four months.
Market sentiment
TapChiBitcoin16m ago
Market "Cash is King"! Iran War and Inflation Squeeze, Bitcoin Price Under Pressure
Bitcoin is under pressure near $70,791 as U.S. 5-year Treasury yields rise to a 9-month high, accompanied by inflation concerns triggered by the Iran conflict. Market capital is tilting toward cash holdings, weakening demand for Bitcoin. Analysts predict it may retest the $66,000 support level. With rising probability of rate hikes, market speculative demand for Bitcoin is diminishing, and overall risk assets are also facing pressure.
MarketWhisper24m ago
CLARITY Draft Limits Stablecoin Yields, CRCL Stock Plunges 20% in a Single Day
Circle (CRCL) stock price plummeted nearly 20% following the introduction of the CLARITY Act draft, which proposes restrictions on stablecoin passive yields. The legislation aims to prevent stablecoin issuers from offering interest similar to bank deposits, which could impact Circle's profit model and market competitiveness. Analysts point out that the current decline may represent market overreaction, as USDC circulation continues to grow and the legislation remains in the negotiation phase with uncertain outcomes.
MarketWhisper40m ago
XRP Today's News: Swift Opens Pathway Through Ten Thousand Banks, Token Remains Under Pressure at $1.40
Swift will launch blockchain-based cross-border payment functionality with over 25 banks, integrating Ripple's XRP as a liquidity bridge asset. Despite regulatory barriers being removed, XRP's price continues to hover around $1.40, with institutional funds comprising only 16% of ETF holdings. Technical analysis shows this price level will impact future market trends, with the market remaining divided on XRP's valuation.
MarketWhisper48m ago
US Treasury Yields Rise, Iran Tensions Persist, Inflation Risks Press Bitcoin Prices
Bitcoin tests the $67,500 support level again, gold prices pull back significantly, and markets reduce risk assets due to concerns about Iran conflict and inflation impacts. U.S. Treasury yields rise, indicating investors shifting to cash amid economic uncertainty.
金色财经_1h ago
