
For most of this cycle, the LINK price has followed a pretty familiar script on the LINK/BTC chart. It rallies, runs into resistance, then slowly rolls over and heads lower again.
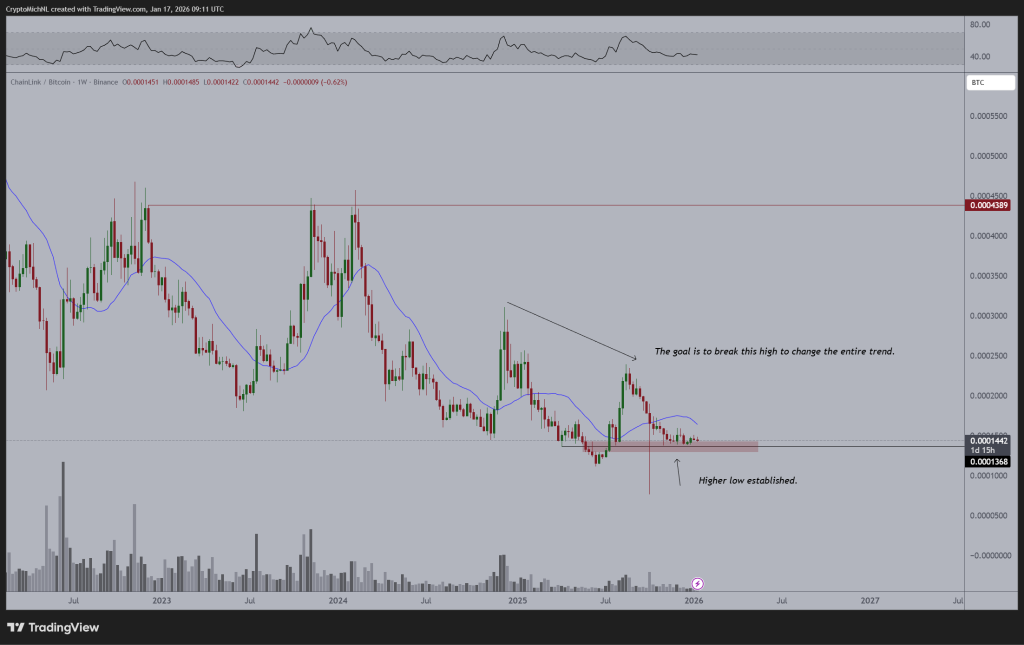
That’s why Michaël van de Poppe’s comment stands out this time. When he says the chart is forming the first higher low since the bear market, it’s not just talk. You can see it clearly on the chart.
Instead of a breakdown into brand-new lows beneath the region of $12.00-$12.50, LINK saw a price action lower into a region of support around $13.70. This in itself does not mean a reversal of the trend but does indicate that some form of change is taking place beneath the surface level of the market action. Such change usually happens before a major movement and not after.
- Why This Higher Low Matters More Than It Looks
- The Level That Decides Everything for LINK
- What’s Next for LINK?
Why This Higher Low Matters More Than It Looks
Looking at the right side of the chart shared by Michaël, the LINK price pushed sharply into support, printed a long downside wick near $13.70, and then bounced. That zone has now turned into a base, and sellers haven’t been able to force a breakdown below it so far. That’s a big difference compared to earlier phases of the downtrend.
Source: X/@CryptoMitchNL
In previous attempts, every bounce eventually gave way to lower lows under $13.00. This time, the LINK price stopped higher and started consolidating above support. That tells you buyers are stepping in earlier, which is often how trend changes begin.
As long as LINK holds above the $13.50–$13.70 region, pullbacks start to look more like healthy retests rather than warning signs.
The Level That Decides Everything for LINK
Still, the chart makes one thing very clear. The LINK price has a major hurdle overhead. The prior swing high around $16.50–$17.00 is the level that needs to break to actually flip the trend. Until that happens, this move remains a recovery phase, not a confirmed reversal.
There’s also a key moving average cutting through the chart near $15.00 that has capped upside for months. The LINK price is now pressing into that area again. A clean break and hold above $15.00 would increase the chances of a push toward $17.00. If that level rejects price again, LINK could spend more time ranging between $13.70 and $15.00.
Chainlink (LINK) Whales Are Loading Up and the $100 LINK Conversation Is Back_**
What’s Next for LINK?
Momentum indicators aren’t showing extreme conditions right now, and that’s not a bad thing. The LINK price isn’t overheated above $18.00, nor is it collapsing under support. It’s sitting in a decision zone where the market has to prove whether this higher low actually matters.
If this base continues to hold and the LINK price starts challenging $16.50 and beyond, the structure finally begins to change. Until then, this is the quiet phase, where the chart builds pressure before revealing its next real direction.
Disclaimer: The information on this page may come from third parties and does not represent the views or opinions of Gate. The content displayed on this page is for reference only and does not constitute any financial, investment, or legal advice. Gate does not guarantee the accuracy or completeness of the information and shall not be liable for any losses arising from the use of this information. Virtual asset investments carry high risks and are subject to significant price volatility. You may lose all of your invested principal. Please fully understand the relevant risks and make prudent decisions based on your own financial situation and risk tolerance. For details, please refer to
Disclaimer.
Related Articles
Meme coins’ decline hits a historic high, with 40% of the tokens nearing their historic lows
Analyst Darkfost pointed out that more than 40% of altcoin prices are approaching historical lows, reflecting market pressure and structural issues. Despite the downturn, identifying resilient projects may deliver long-term returns. Investors should focus on fundamentals and market resilience, uncovering opportunities at lower levels to prepare for the coming phase of divergence in market conditions.
GateNews2m ago
Bitcoin ETFs Shed Nearly $300M as Risk-Off Pressure Builds Across Markets
U.S. spot Bitcoin ETFs experienced approximately $296 million in net outflows from March 24 to March 27 due to growing market risk aversion amidst geopolitical and macroeconomic pressures, indicating broader investor de-risking trends.
CryptoNewsFlash36m ago
XRP Price News: On-Chain Outflows Surge, Possibly Signaling Potential Demand; XRP’s April Average Return Rate Is About 24.8%
XRP has been weak over the past 24 hours, falling more than 2%. Despite the short-term pullback, its on-chain activity and withdrawal transaction volume have rebounded, suggesting investors’ long-term willingness to hold the asset. Analysis indicates that seasonal factors may present an opportunity for XRP to move higher, and traders should monitor outflow transaction dynamics to gauge its future direction.
GateNews37m ago
Bitcoin Floor Models Point to a Potential Bottom Near $46K as Capital Weakens
Bitcoin's onchain models indicate a potential bottom between $46,000 and $54, according to analyst Willy Woo. While historical support remains, declining capital raises concerns about the model's reliability amid changing market conditions.
CryptoNewsFlash40m ago
17.83% Plunge for TWT: What Traders Should Know
Trust Wallet Token (TWT) experienced a rapid 17.83% drop in just 15 minutes, reflecting broader market volatility. With trading volume at $4 million and mixed market signals, traders are monitoring key support and resistance levels for future direction.
Coinfomania52m ago
The Bitcoin Fear and Greed Index has fallen to 8, hitting a new low for the current cycle, with fear persisting for nearly 60 days. When will the market bottom out?
Bitcoin market sentiment remains depressed, and the Fear and Greed Index has fallen to 8. It has been at extreme fear for 59 days, mainly driven by high interest rates and the global economic environment. Despite retail traders’ low sentiment, long-term holders are still transferring assets. The market faces structural disagreement, and future price action will depend on changes in macro liquidity.
GateNews58m ago
