
Key Takeaways
-
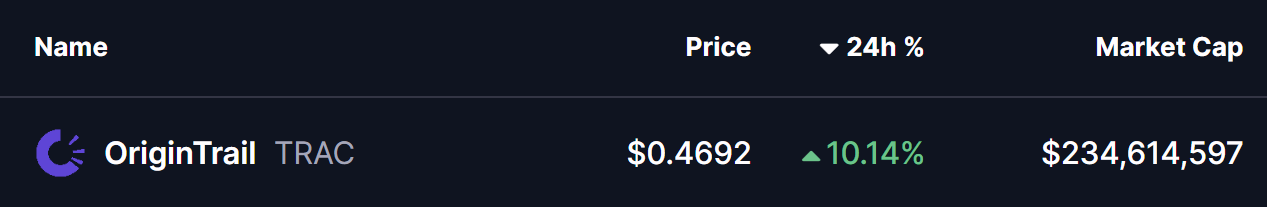
OriginTrail (TRAC) has surged around 12% in a single day, drawing renewed attention to the token.
-
TRAC has broken out from an ascending triangle near $0.46 on the daily chart, signaling growing bullish momentum.
-
Similar breakout structures in July and October 2025 previously led to strong rallies of 63% and 113%.
-
Holding the $0.44–$0.46 zone as support will be crucial to keep the bullish fractal setup intact.
-
If the pattern plays out, TRAC could attempt a move toward its long-term ascending resistance above $1.00.
OriginTrail, the decentralized knowledge graph protocol, is stepping back into the spotlight as its native token TRAC records a strong 12% daily surge. Beyond the price jump, the real signal is coming from the charts, where a familiar fractal breakout structure is starting to emerge on the daily timeframe, hinting that a larger upside move could be forming.
Source: Coinmarketcap
Fractal Breakout Hints at Potential Upside Move
On the daily chart, TRAC has confirmed a breakout from an ascending triangle pattern near the $0.46 level. This breakout is particularly important as price is now trading just above the 200-day moving average, a level that has historically acted as a major trend-defining zone for TRAC.
What makes this setup more compelling is its similarity to previous breakout phases. In late July 2025, a comparable structure resulted in a 63% upside move after price held above its breakout base. Later, in early October 2025, TRAC broke out from a right-angled descending broadening wedge pattern. That move was followed by a reclaim of the 200-day moving average and ultimately led to a powerful 113% rally.

OriginTrail (TRAC) Daily Chart/Coinsprobe (Source: Tradingview)
The current setup shares key characteristics with those earlier moves. Price compression, a clean breakout, and interaction with the 200-day MA suggest that TRAC may once again be transitioning from consolidation into expansion.
What’s Next for TRAC?
If this fractal breakout plays out as expected, holding the $0.44–$0.46 zone as support will be crucial. A sustained hold above this range, along with continued strength above the 200-day moving average, could act as a launchpad for further upside.
In that scenario, TRAC may attempt a move toward its long-term ascending resistance trendline, which currently sits above the $1.00 level. A push toward that zone would align closely with the magnitude of prior fractal-driven rallies seen on the chart.
That said, fractal patterns are never guarantees. Broader market conditions, liquidity, and overall sentiment will continue to influence price action. A failure to hold the $0.44–$0.46 support zone or a rejection back below the 200-day moving average could invalidate the breakout and weaken the bullish fractal thesis.
Bottom Line
TRAC is showing early signs of another technically significant breakout, supported by historical fractal behavior and a reclaim of a key long-term moving average. If buyers can defend the current support zone, the chart suggests that OriginTrail may be positioning itself for a larger upside move in the weeks ahead.
Disclaimer: The views and analysis presented in this article are for informational purposes only and reflect the author’s perspective, not financial advice. Technical patterns and indicators discussed are subject to market volatility and may or may not yield the anticipated results. Investors are advised to exercise caution, conduct independent research, and make decisions aligned with their individual risk tolerance.
About Author: Nilesh Hembade is the Founder and Lead Author of Coinsprobe, with over 5 years of experience in the cryptocurrency and blockchain industry. Since launching Coinsprobe in 2023, he has been providing daily, research-driven insights through in-depth market analysis, on-chain data, and technical research.
Disclaimer: The information on this page may come from third parties and does not represent the views or opinions of Gate. The content displayed on this page is for reference only and does not constitute any financial, investment, or legal advice. Gate does not guarantee the accuracy or completeness of the information and shall not be liable for any losses arising from the use of this information. Virtual asset investments carry high risks and are subject to significant price volatility. You may lose all of your invested principal. Please fully understand the relevant risks and make prudent decisions based on your own financial situation and risk tolerance. For details, please refer to
Disclaimer.
Related Articles
Ripple CTO: Current XRP Price May Deviate from Market Expectations, but Will Be Corrected in the Long Term
Ripple Chief Technology Officer David Schwartz stated that despite XRP's role in the payments space and rising institutional adoption, its current price of approximately $1.50 may be undervalued, noting that market participants will exploit pricing discrepancies to correct the price.
GateNews29m ago
Bitcoin Breaks Below $71,000, Peter Brandt Warns of Two-Way Movement Risk
On March 19th, Bitcoin's price fell below $71,000, declining approximately 5% within 24 hours. Ethereum, Solana, and Dogecoin all dropped 5% to 6%, with total market capitalization evaporating over $100 billion. Senior traders point out that Bitcoin exhibits both bullish and bearish technical patterns, and macroeconomic factors are affecting market sentiment, with short-term trends remaining uncertain.
GateNews48m ago
Cardano (ADA) trades within a multi-year accumulation zone, with analysts monitoring its potential upside.
Cardano (ADA) is currently trading in the support zone of $0.18 to $0.25, which has historically bounced multiple times. Analysts point out that if this support holds and breaks through the downtrend line, ADA could rally to $1 and $3, representing gains of 270% and 1,011% respectively. Maintaining support is key to a bullish outlook.
GateNews48m ago
Bitcoin Briefly Falls Below $70,000 Mark During Asian Session as Fed Hawkishness and Macro Uncertainty Weigh on Market Volatility
Bitcoin fell below 70,000 on March 19, touching approximately 69,537, reflecting market concerns about the Federal Reserve maintaining high interest rates. Bitcoin subsequently rebounded to around 70,180, demonstrating psychological support at the 70,000 level. Despite improved market fund inflows, cryptocurrencies continue to face challenges amid global macroeconomic pressures, with 70,000 becoming a critical near-term level.
区块客57m ago
MICA Daily | Is the Fed Worried About Inflation Getting Out of Control? US Stocks Decline, BTC Tests $71,000 Again
Yesterday, BTC fell from $73,000 to $71,000 due to declining US stocks and deteriorating Middle East conditions, with risk-off sentiment heating up in the market. The Federal Reserve kept interest rates unchanged, with Powell emphasizing that the US employment market and energy crisis make decision-making difficult, indicating uncertain economic prospects ahead that could impact both stock and crypto markets.
区块客1h ago
The Federal Reserve maintains interest rates, Bitcoin is pressured near $70,000, and the Iran conflict escalation increases market uncertainty.
The Federal Reserve kept its benchmark interest rate unchanged on March 19, with a voting result of 11 to 1. Chairman Powell pointed out that the situation in the Middle East and rising oil prices introduce uncertainties to the economy, and short-term inflation expectations have been raised to 2.7%. The market response was notable, with risk assets performing poorly. Analysts advise paying attention to future interest rate movements.
GateNews1h ago
