
**Date: **Wed, Jan 07, 2026 | 06:20 AM GMT
The broader cryptocurrency market continues to show strong New Year momentum, with Bitcoin (BTC) up around 4% and Ethereum (ETH) gaining over 9% on a weekly basis. This improving sentiment is gradually spilling over into major altcoins — including the DePIN-focused token Akash Network (AKT).
AKT has already posted an impressive 20% weekly gain. While this short-term strength has caught traders’ attention, the more important development is unfolding on the higher-timeframe chart. Recent price action suggests a meaningful shift in market structure, hinting that AKT may be transitioning out of a prolonged corrective phase and into the early stages of a bullish continuation.
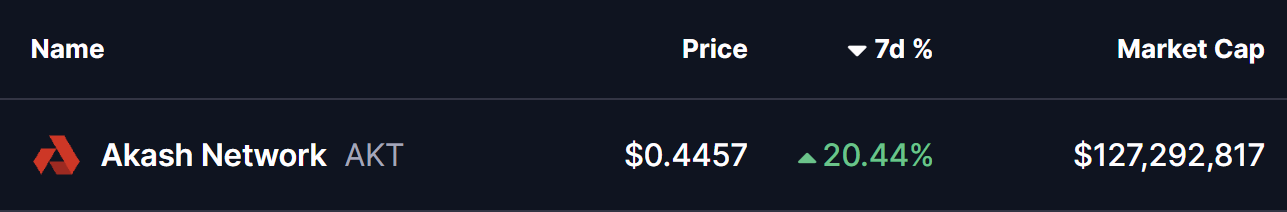
Source: Coinmarketcap
Falling Wedge and Rounding Bottom in Play
On the daily chart, AKT has been trading within a broader falling wedge — a structure that often precedes bullish reversals as selling pressure gradually weakens. Within this larger wedge, price action is also shaping a developing rounding bottom pattern, reflecting steady accumulation and seller exhaustion.
The formation began after AKT faced strong rejection near the $0.5441 resistance zone in late November. That rejection triggered a sharp sell-off, pushing price lower toward the $0.3465 region. However, bears failed to extend losses beyond this area. Instead, demand stepped in, downside momentum slowed, and price began to stabilize.
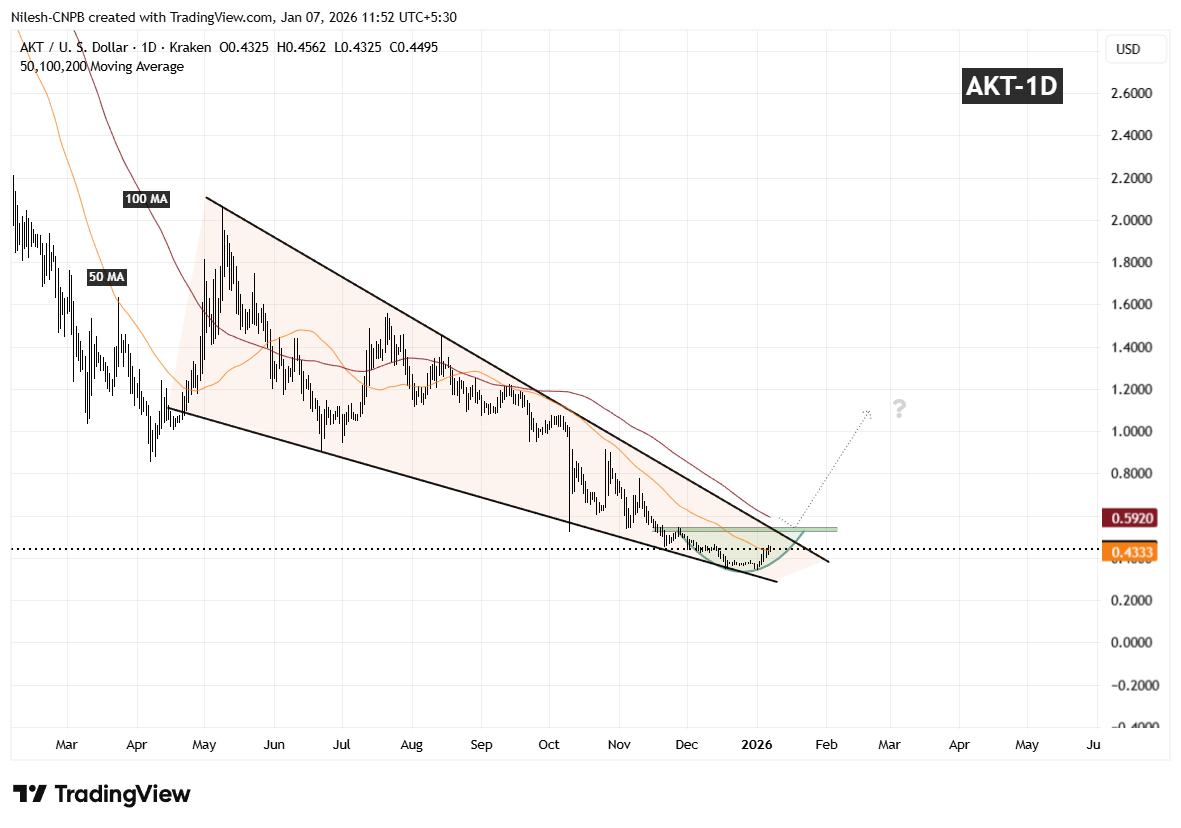
Akash Network (AKT) Daily Chart/Coinsprobe (Source: Tradingview)
Over the following weeks, volatility compressed and AKT started to curl higher in a smooth, rounded fashion — closely matching the textbook behavior of a rounding bottom. Importantly, the recent rebound has pushed price back above the 50-day moving average around $0.4333, a level that had previously acted as resistance and is now beginning to flip into support.
What’s Next for AKT?
If AKT can continue to hold above the 50-day moving average, this area may act as a solid base for further upside attempts. From here, attention shifts toward the descending resistance trendline of the falling wedge, which aligns closely with the $0.5441 resistance zone.
A clean and decisive breakout above this confluence area, followed by sustained acceptance, would confirm a broader bullish expansion phase and mark a clear trend reversal from the prior downtrend. Such a move would likely attract renewed momentum participation as the market recognizes the structural shift.
Until that breakout occurs, the pattern remains in development. Short-term consolidation or shallow pullbacks are still possible as price digests recent gains. However, as long as AKT continues to print higher lows above the established base, the broader technical structure remains constructive.
Overall, the chart suggests AKT is approaching a critical inflection point — one that could determine whether this recovery evolves into a sustained bullish trend as 2026 progresses.
Disclaimer: The views and analysis presented in this article are for informational purposes only and reflect the author’s perspective, not financial advice. Technical patterns and indicators discussed are subject to market volatility and may or may not yield the anticipated results. Investors are advised to exercise caution, conduct independent research, and make decisions aligned with their individual risk tolerance.
About Author: Nilesh Hembade is the Founder and Lead Author of Coinsprobe, with over 5 years of experience in the cryptocurrency and blockchain industry. Since launching Coinsprobe in 2023, he has been providing daily, research-driven insights through in-depth market analysis, on-chain data, and technical research.
Disclaimer: The information on this page may come from third parties and does not represent the views or opinions of Gate. The content displayed on this page is for reference only and does not constitute any financial, investment, or legal advice. Gate does not guarantee the accuracy or completeness of the information and shall not be liable for any losses arising from the use of this information. Virtual asset investments carry high risks and are subject to significant price volatility. You may lose all of your invested principal. Please fully understand the relevant risks and make prudent decisions based on your own financial situation and risk tolerance. For details, please refer to
Disclaimer.
Related Articles
Tether’s USDT Stablecoin Gears Up To Flip Ethereum In Market Cap
An ongoing event contract on Polymarket indicates Ethereum could lose its spot as the second-largest crypto by market cap this year.
Analysts expect Tether’s USDT stablecoin to overtake ETH’s overall valuation within the same period.
An ongoing event contract in Polymarket predicts Ethereum (ETH)
Blockzeit13m ago
Cardano’s Treasury Spent Millions While ADA Price Sinks – Community Demands Answers!
Cardano's recent drop to 13th place on CoinMarketCap has frustrated long-time holders, as the project struggles to recover its market cap. Community member Bobcorn criticizes treasury spending, arguing it benefits developers while investors suffer losses. The divide persists, with some supporting infrastructure investments for future growth, while others see them as wasteful during poor performance.
CaptainAltcoin19m ago
Bitcoin Faces Extended Weakness Below Key Cost Basis
Bitcoin struggles below the $72.5K realized price, indicating resistance and prolonged bearish sentiment. Repeated rejections at $71K and a drop to $66K demonstrate strong selling pressure. Indicators suggest fragile recovery, with risks of further declines if support fails.
CryptoFrontNews34m ago
The cryptocurrency market's trading volume has dropped back to the levels of the 2022 bear market, with ETH's trading volume decreasing more than BTC's, and Gas fees hitting an all-time low.
The average weekly trading volume in the cryptocurrency market has fallen to $90 billion, a decrease of 7% from the mean, indicating that activity has dropped to levels seen during the bear market of 2022; Ethereum gas fees have fallen to historic lows, reflecting a contraction in on-chain activity. Both Bitcoin and Ethereum trading volumes are below the average, with funding rates recovering but still at low levels. The market is currently in a quiet state, lacking clear catalysts.
動區BlockTempo44m ago
RAIN Crypto Price Dips: Will the $10M Sell-Off Halt Recovery?
RAIN drops over 17% after $10M sell-off despite institutional support.
RAIN trades below key $0.0082 support, raising concerns about market cap decline.
Whale activity and green candles suggest potential rebound if momentum sustains.
Rain Protocol — RAIN, has seen a sharp decline,
CryptoNewsLand58m ago
‘Extreme Fear’ Is Back but Bitcoin’s Price Recovery Depends on it: Santiment
Bitcoin dipped to a four-week low on Friday at $65,500 after it was rejected at $72,000 a few days earlier, which pushed the overall market sentiment back to ‘extreme fear’ territory.
However, the analysts from Santiment believe this could be the precise push BTC needs to stage a notable
CryptoPotato1h ago
