
Date: Thu, Jan 01, 2026 | 10:30 AM GMT
As the new year 2026 begins, the broader cryptocurrency market is showing modest weakness, with both Bitcoin (BTC) and Ethereum (ETH) trading slightly in the red. This soft start has weighed on sentiment across the altcoin space as well, including Monad (MON). However, beneath the surface, MON’s chart structure is beginning to tell a more constructive story.
MON is currently down around 4% on the day, extending its 60-day decline to roughly 21%. While short-term price action remains subdued, the more important signal is emerging on the daily chart, where price structure is beginning to hint at a meaningful shift. If confirmed, this setup could mark the early stages of a bullish continuation following a prolonged corrective phase.
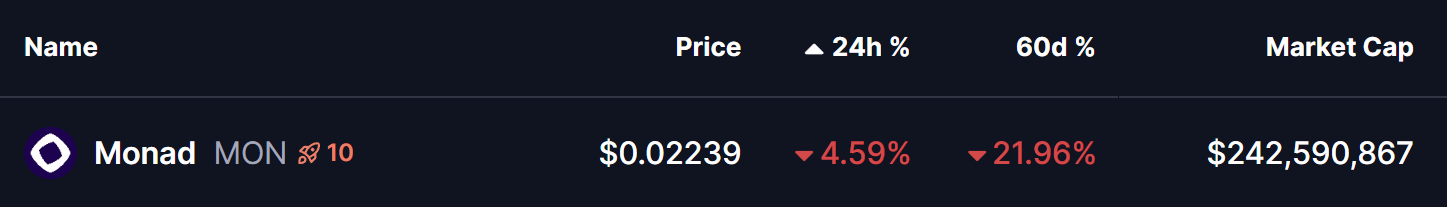
Source: Coinmarketcap
Rounding Bottom in Play
On the daily timeframe, MON appears to be forming a textbook rounding bottom pattern — a classic bullish reversal structure that typically develops after extended downside pressure. This pattern reflects a gradual transition from distribution to accumulation, where selling momentum weakens and buyers begin to step in more consistently.
Previously, MON faced strong rejection near the $0.04923 neckline zone, triggering a sharp decline that unfolded through late November and December. That move eventually found a floor near the $0.017 level, which has since acted as a key demand zone. Repeated defenses of this area prevented any deeper breakdown and helped establish a stable base for a potential trend reversal.
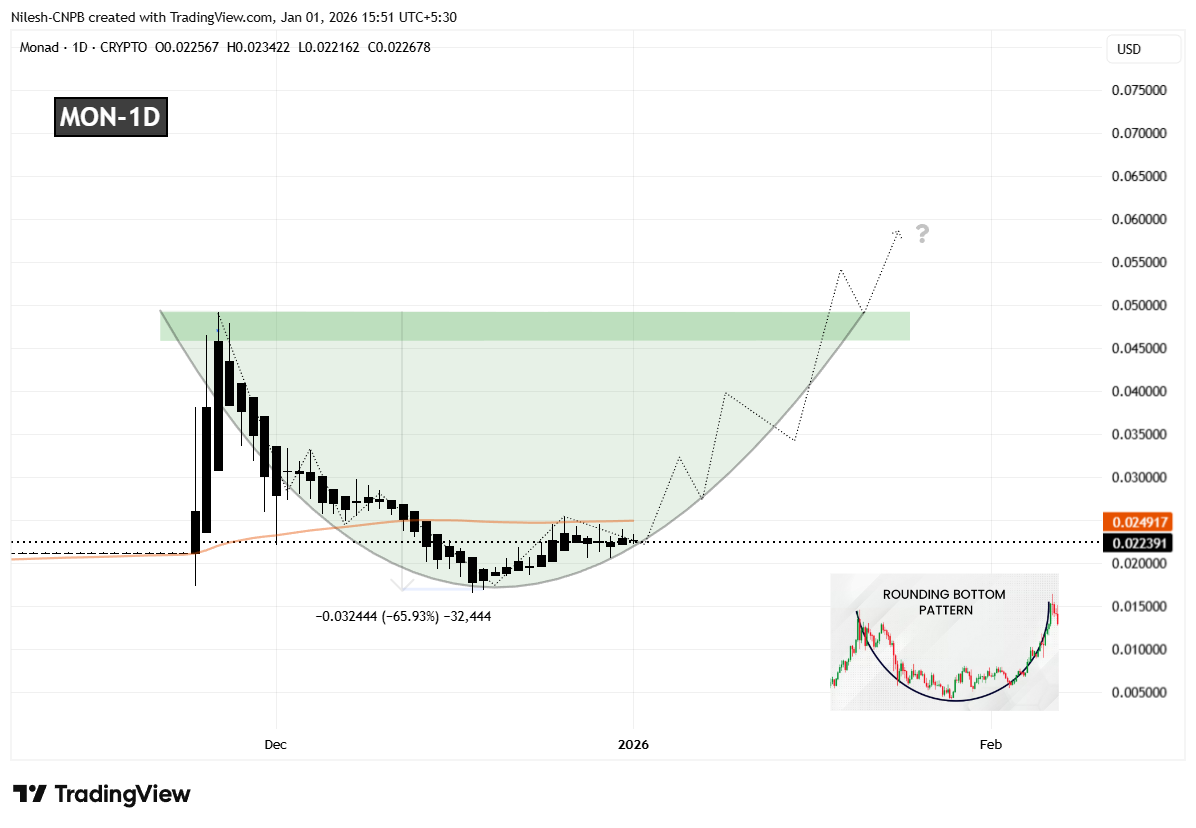
Monad (MON) Daily Chart/Coinsprobe (Source: Tradingview)
Since forming that bottom, MON has started to curve higher in a rounded fashion, closely matching the classic structure of a developing bottoming pattern. This gradual recovery suggests that selling pressure is fading rather than accelerating. The recent stabilization and recovery back above the $0.022 region further indicate that accumulation may be taking place as the market quietly prepares for a larger move.
What’s Next for MON?
For the rounding bottom pattern to move into confirmation, MON needs to reclaim the 50-day moving average, currently positioned near the $0.02491 level. A sustained move above this area would signal a shift in short-term momentum and confirm that buyers are beginning to regain control after months of corrective price action.
Looking ahead, the most significant technical hurdle remains the neckline resistance around $0.04923. A clean and decisive breakout above this zone would validate the entire reversal structure and could open the door for a broader bullish expansion phase, with momentum traders likely returning to the market.
Until those levels are reclaimed, the pattern remains in its early development stage. Short-term pullbacks or consolidation remain possible if MON struggles near the 50-day moving average. However, as long as price continues to hold higher lows above the $0.017 base, the broader bottoming structure remains intact.
Overall, MON’s emerging rounding bottom formation suggests the token may be approaching an important inflection point. While confirmation is still pending, the improving structure and alignment with a classic bullish pattern indicate that the coming sessions could be decisive for Monad’s next directional move.
Disclaimer: The views and analysis presented in this article are for informational purposes only and reflect the author’s perspective, not financial advice. Technical patterns and indicators discussed are subject to market volatility and may or may not yield the anticipated results. Investors are advised to exercise caution, conduct independent research, and make decisions aligned with their individual risk tolerance.
About Author: Nilesh Hembade is the Founder and Lead Author of Coinsprobe, with over 5 years of experience in the cryptocurrency and blockchain industry. Since launching Coinsprobe in 2023, he has been providing daily, research-driven insights through in-depth market analysis, on-chain data, and technical research.
Disclaimer: The information on this page may come from third parties and does not represent the views or opinions of Gate. The content displayed on this page is for reference only and does not constitute any financial, investment, or legal advice. Gate does not guarantee the accuracy or completeness of the information and shall not be liable for any losses arising from the use of this information. Virtual asset investments carry high risks and are subject to significant price volatility. You may lose all of your invested principal. Please fully understand the relevant risks and make prudent decisions based on your own financial situation and risk tolerance. For details, please refer to
Disclaimer.
Related Articles
DeFi Hack Triggers $9 Billion in Outflows from Aave as Stolen Tokens Used as Collateral
A recent hack draining nearly $300 million from a crypto project led to a liquidity crisis on Aave, causing users to withdraw around $9 billion. Concerns over collateral quality prompted mass withdrawals, highlighting risks in DeFi lending.
GateNews23m ago
Crypto Expert Claims Altseason Peak Is Just Starting, XRP Could Lead With Explosive Gains
Crypto expert claims altseason peak is just starting.
The price of XRP could lead with explosive gains soon.
Several altcoin assets are showing steady bullish signals.
The crypto market has seen very slow growth in altcoin prices this bull cycle. While the price of Bitcoin (BTC), the
CryptoNewsLand23m ago
Tensions around the Strait of Hormuz have been fluctuating, and Bitcoin falls below $74,000
The Strait of Hormuz blockade triggers a major shock in the crypto market: after Bitcoin first breaks above $78,000, it then falls back to $74,000, and the market remains in panic. This article provides an in-depth analysis of the transmission mechanism between geopolitical shocks and crypto market price action.
GateInstantTrends1h ago
Crypto Jack Warns Bitcoin May Drop to $48K Amid Geopolitical Tensions
Crypto trader Crypto Jack warns investors to sell Bitcoin, predicting a decline to $48,000 amidst US-Iran tensions and negative financial signals, before a potential recovery in May based on seasonal trends.
CryptoFrontier2h ago
Bitcoin’s fourth halving rally is slowing down, analysts say: BTC may have entered a “new normal”
Investment firm Galaxy analyst Alex Thorn noted that Bitcoin’s advance during this halving cycle has been lower than historical records, with volatility declining, and the market may be entering a new normal. Compared with the past three halvings, the fourth time’s price change is no longer significant. While the passage of U.S. spot ETFs has catalyzed the rally, the market’s ongoing conditions still need to be watched closely.
ChainNewsAbmedia2h ago
ETH jumps 1.22% in 15 minutes: DeFi segment activity and trading volume surge resonate to drive the move
2026-04-20 07:15 to 07:30 (UTC), ETH’s short-term return reached +1.22%. The price range spanned from 2285.19 to 2332.62 USDT, with a 2.07% amplitude. During this period, market attention heated up, volatility noticeably intensified. On-chain transaction volume rose in tandem, and key mainstream on-chain activity indicators expanded significantly on a month-over-month basis.
The primary driver of this deviation was an increase in transaction activity related to DeFi protocols, which boosted the share of on-chain Gas consumption. At the same time, total on-chain transaction volume saw a sharp surge in a short time. DeFi scenarios such as decentralized exchanges and lending protocols led to a direct surge in demand for ETH, driving funds to flow quickly into the market. In addition, the average Gas fees and Gas prices on the ETH network continued to climb in this window, further validating that high-frequency trading and active capital were accelerating into the market and strengthening short-term bullish sentiment.
Second, on-chain data also showed an expansion in liquidity related to stablecoins and ERC20 assets, strengthening market buy-side power. Although historical large-wallets such as Wilcke still held a large amount of ETH after early March, this cycle did not trigger abnormal transfers or large-scale sell-offs. Meanwhile, the positioning structure of mainstream ETH did not show passive deleveraging or concentrated liquidation. Under the combined effects of multiple factors, global buy-side demand was amplified, and short-term ETH volatility was further elevated.
Be alert to the risk of capital sustainability after a surge in high-frequency trading volume and Gas fees. If subsequent incremental buying is lacking or on-chain attention cools down, ETH may face short-term pullback pressure. Monitor changes in large-holder positions, any abnormal shifts in network fees, and liquidity volatility on the DeFi protocol chain. While there have been no signs of security incidents involving major contracts and protocols so far, short-term liquidity disturbances still need close observation. Keep monitoring fund flows and on-chain structure to stay informed about subsequent market changes.
GateNews3h ago
