
Date: Mon, Dec 29, 2025 | 04:10 PM GMT
The broader cryptocurrency market has seen a short-term pullback over the past few hours, with Bitcoin (BTC) slipping below the $87K level after briefly trading above $90K. This retracement has spilled over into major altcoins, including Avalanche (AVAX), which is also experiencing mild selling pressure.
AVAX is trading slightly in the red today, but beneath the surface, its price structure is beginning to tell a more constructive story. The 4-hour chart reveals a high-probability bullish setup that could hint at a stronger upside move once momentum fully shifts back in favor of buyers.
Source: Coinmarketcap
Power of 3 Pattern Takes Shape
On the 4-hour timeframe, AVAX appears to be forming a classic Power of 3 (PO3) pattern — a structure commonly linked to smart money accumulation and trend continuation. This pattern typically unfolds in three distinct phases: accumulation, manipulation, and expansion, often preceding a sharp directional move.
Accumulation Phase
During the accumulation phase, AVAX spent an extended period trading sideways within a defined range, capped by resistance near $14.80 and supported around $12.64. This tight consolidation reflected balance between buyers and sellers, allowing larger participants to quietly build positions while volatility remained compressed.
The prolonged range-bound action signaled that selling pressure was gradually being absorbed, even as the broader trend remained weak.
Manipulation Flush
The manipulation phase played out when AVAX briefly broke below the $12.64 support, triggering a sharp downside move toward the $11.31 area. This sudden drop resembles a classic liquidity sweep, where stop-loss orders and late sellers are flushed out before a reversal takes place.
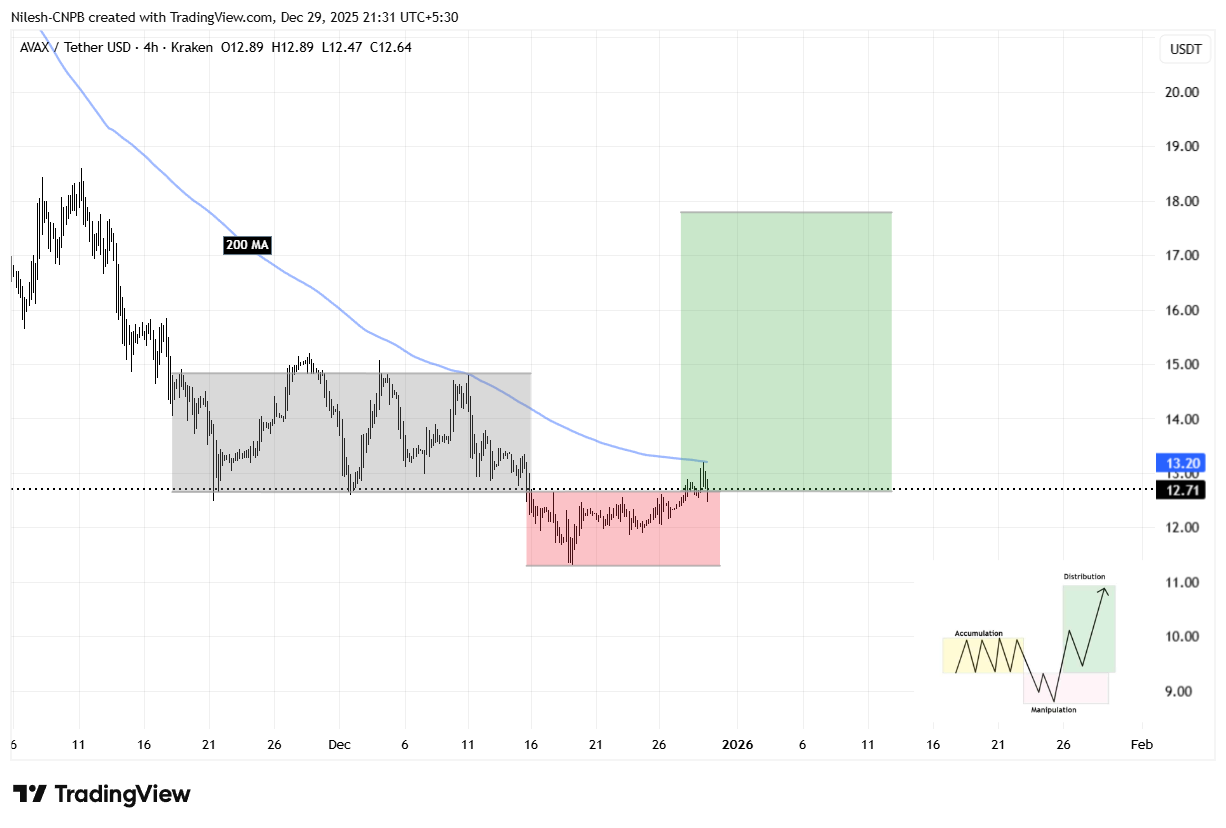
Avalanche (AVAX) 4H Chart/Coinsprobe (Source: Tradingview)
Expansion Phase Begins to Unfold
Following the sweep of lows, AVAX rebounded quickly and reclaimed the $12.64 level, signaling that buyers have stepped back in with conviction. This recovery suggests the early stages of the expansion phase may now be underway.
Price is currently pushing toward the 200-hour moving average near $13.20, a level that has consistently acted as dynamic resistance during the broader downtrend. A sustained move above this moving average would represent a meaningful shift in short-term momentum and strengthen the bullish reversal narrative.
What’s Next for AVAX?
If AVAX manages to break and hold above the 200-hour moving average, the next major resistance lies at $14.80 — the upper boundary of the prior accumulation range. A decisive reclaim of this zone would confirm a bullish breakout and likely attract fresh momentum participation.
Based on the Power of 3 structure, a successful breakout could open the door for a measured move toward the $18.29 region, derived from projecting the height of the accumulation range upward from the breakout point. This target aligns closely with the expansion zone highlighted on the chart.
That said, caution remains necessary. A failure to hold above $12.64 would weaken the expansion thesis and could force AVAX back into consolidation, delaying any meaningful upside continuation.
For now, AVAX sits at a technically critical inflection point. The structure suggests that smart money positioning may already be in progress, with the coming sessions likely to determine whether the expansion phase fully materializes.
Disclaimer: The views and analysis presented in this article are for informational purposes only and reflect the author’s perspective, not financial advice. Technical patterns and indicators discussed are subject to market volatility and may or may not yield the anticipated results. Investors are advised to exercise caution, conduct independent research, and make decisions aligned with their individual risk tolerance.
About Author: Nilesh Hembade is the Founder and Lead Author of Coinsprobe, with over 5 years of experience in the cryptocurrency and blockchain industry. Since launching Coinsprobe in 2023, he has been providing daily, research-driven insights through in-depth market analysis, on-chain data, and technical research.
Disclaimer: The information on this page may come from third parties and does not represent the views or opinions of Gate. The content displayed on this page is for reference only and does not constitute any financial, investment, or legal advice. Gate does not guarantee the accuracy or completeness of the information and shall not be liable for any losses arising from the use of this information. Virtual asset investments carry high risks and are subject to significant price volatility. You may lose all of your invested principal. Please fully understand the relevant risks and make prudent decisions based on your own financial situation and risk tolerance. For details, please refer to
Disclaimer.
Related Articles
Bitcoin ETFs Shed Nearly $300M as Risk-Off Pressure Builds Across Markets
U.S. spot Bitcoin ETFs experienced approximately $296 million in net outflows from March 24 to March 27 due to growing market risk aversion amidst geopolitical and macroeconomic pressures, indicating broader investor de-risking trends.
CryptoNewsFlash16m ago
XRP Price News: On-Chain Outflows Surge, Possibly Signaling Potential Demand; XRP’s April Average Return Rate Is About 24.8%
XRP has been weak over the past 24 hours, falling more than 2%. Despite the short-term pullback, its on-chain activity and withdrawal transaction volume have rebounded, suggesting investors’ long-term willingness to hold the asset. Analysis indicates that seasonal factors may present an opportunity for XRP to move higher, and traders should monitor outflow transaction dynamics to gauge its future direction.
GateNews18m ago
Bitcoin Floor Models Point to a Potential Bottom Near $46K as Capital Weakens
Bitcoin's onchain models indicate a potential bottom between $46,000 and $54, according to analyst Willy Woo. While historical support remains, declining capital raises concerns about the model's reliability amid changing market conditions.
CryptoNewsFlash21m ago
17.83% Plunge for TWT: What Traders Should Know
Trust Wallet Token (TWT) experienced a rapid 17.83% drop in just 15 minutes, reflecting broader market volatility. With trading volume at $4 million and mixed market signals, traders are monitoring key support and resistance levels for future direction.
Coinfomania33m ago
The Bitcoin Fear and Greed Index has fallen to 8, hitting a new low for the current cycle, with fear persisting for nearly 60 days. When will the market bottom out?
Bitcoin market sentiment remains depressed, and the Fear and Greed Index has fallen to 8. It has been at extreme fear for 59 days, mainly driven by high interest rates and the global economic environment. Despite retail traders’ low sentiment, long-term holders are still transferring assets. The market faces structural disagreement, and future price action will depend on changes in macro liquidity.
GateNews39m ago
Trump speaks out, combined with Iran calling for more, and the S&P 500 surged by $90 billion overnight
By the end of March 2026, due to remarks by Iran’s parliamentary speaker and comments by Trump that influenced the U.S. stock market sentiment, the U.S. stock market experienced volatility, and the S&P 500’s market capitalization rebounded by approximately $900 billion in the short term. The market is highly sensitive and responds noticeably to political statements. Despite the stock market rebound, oil prices remain high, and ongoing geopolitical impacts continue to attract investor attention; the future market trend will depend on the progress of negotiations.
GateNews39m ago
