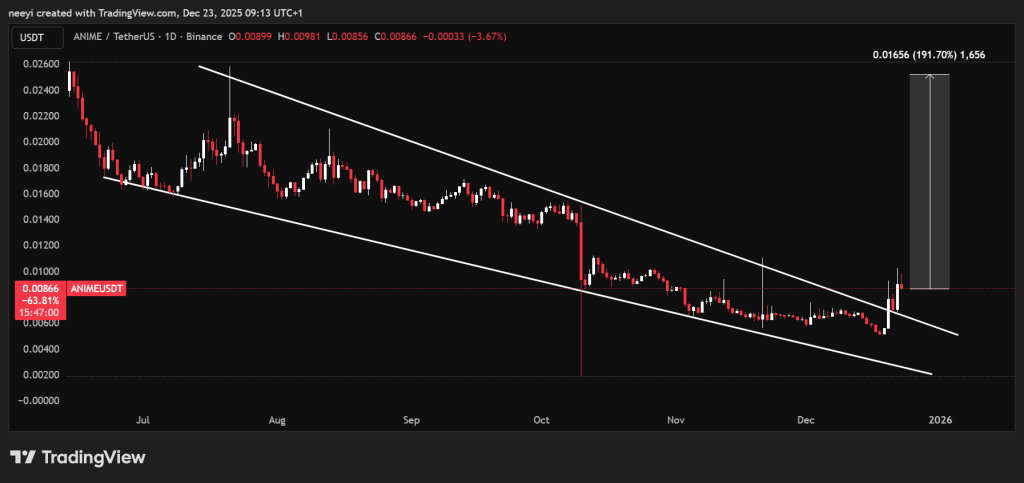
 Animecoin (ANIME) price has been impressive recently, despite the price of other cryptos struggling. The token has had more than a 60% price increase in the past 3 days. A quick look at the chart shows that the price broke out from a months-long descending channel. This happened three days ago with a 40% price increase within a single day. The following day, the price tested the broken support as new support successfully.
This move brought in more buyers who are now interested in the token and hope to join a late bullish ride. Going by the height of the descending channel, one might still expect more than a 190% increase from the current level of around $0.0086 before any major pullback if the bullish momentum continues.
The recent breakout changed how ANIME price behaves on the chart. Price spent months moving lower inside a descending channel, which often signals slow distribution and fading interest. That structure ended once buyers pushed the price above the upper boundary with strong follow-through.
Animecoin (ANIME) price has been impressive recently, despite the price of other cryptos struggling. The token has had more than a 60% price increase in the past 3 days. A quick look at the chart shows that the price broke out from a months-long descending channel. This happened three days ago with a 40% price increase within a single day. The following day, the price tested the broken support as new support successfully.
This move brought in more buyers who are now interested in the token and hope to join a late bullish ride. Going by the height of the descending channel, one might still expect more than a 190% increase from the current level of around $0.0086 before any major pullback if the bullish momentum continues.
The recent breakout changed how ANIME price behaves on the chart. Price spent months moving lower inside a descending channel, which often signals slow distribution and fading interest. That structure ended once buyers pushed the price above the upper boundary with strong follow-through.
ADA Price Chart
Price action after the breakout matters just as much as the breakout itself. The clean retest of former resistance as support confirmed that buyers were willing to defend higher levels. That confirmation phase often attracts fresh interest because it reduces the risk of a false breakout.
Momentum since then has remained steady rather than explosive. That kind of movement usually points to accumulation rather than a short lived spike.
- CoinMarketCap Data Shows Mixed Signals Behind The Rally
- GameSquare Treasury Move Put Animecoin Back On Radar
- Post-Launch Supply Pressure Still Shapes ANIME Price Outlook
- RSI And MACD Readings Support Continued Momentum
CoinMarketCap Data Shows Mixed Signals Behind The Rally
Data from CoinMarketCap adds more context to the move. On the surface, ANIME price strength looks technical driven, yet the broader picture remains mixed.
One factor supporting optimism came from a treasury allocation narrative tied to gaming and media exposure. Another layer of discussion focuses on leveraged positioning, where aggressive long setups often amplify short term volatility.
At the same time, CoinMarketCap data highlights a much larger drawdown from earlier valuations. That history still hangs over the asset and explains why price reactions remain sharp in both directions.
GameSquare Treasury Move Put Animecoin Back On Radar
A notable catalyst behind renewed attention involves GameSquare Holdings and its plan to add ANIME to its treasury. Analysts following the project have pointed to this development as a potential credibility boost rather than a guaranteed price driver.
A publicly traded company allocating capital creates a different type of narrative. The focus shifts from short term trading to strategic positioning within gaming and digital culture. That angle fits Animecoin’s branding and explains why the move attracted renewed market interest.
Follow through remains important. Treasury announcements matter most when buying activity is visible over time rather than remaining a one off headline.
Post-Launch Supply Pressure Still Shapes ANIME Price Outlook
Another analyst angle centers on supply dynamics after launch. ANIME price remains far below its initial valuation, which reflects broader issues seen across many 2025 token launches.
A large maximum supply combined with future token releases continues to weigh on sentiment. Roughly 3.2B tokens are still scheduled for release, which introduces dilution risk if demand does not grow alongside supply.
This backdrop explains why rallies face skepticism even when price structure improves. Strength needs to persist long enough to absorb upcoming supply rather than fade on the first wave of selling.
RSI And MACD Readings Support Continued Momentum
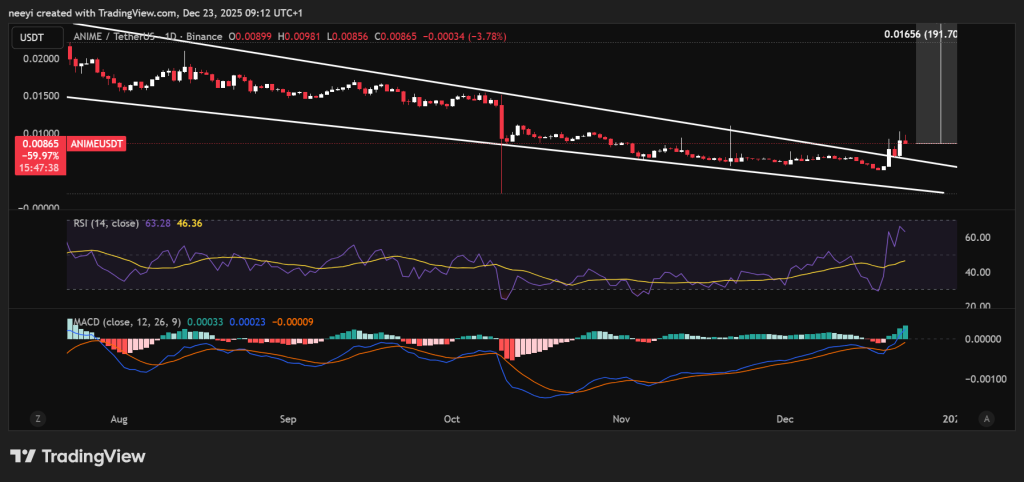
Technical indicators offer additional insight into where ANIME price stands right now. The relative strength index sits near 63 at the time of writing. That level suggests momentum favors buyers without pushing into overheated territory. RSI above 50 usually signals bullish control, while readings below 70 leave room for further upside before exhaustion becomes a concern.
ADA Price Chart Showing RSI and MACD Readings
MACD readings from the attached chart also lean positive. The MACD line remains above the signal line, and the histogram continues to print positive values. That combination typically points to sustained upward momentum rather than a fading move. Traders often view this setup as confirmation that the trend still favors continuation rather than immediate reversal.
Read Also: How Much Could 1,000 Cardano (ADA) Tokens Be Worth by 2030?
ANIME price strength reflects a mix of technical breakout, renewed narrative interest, and improving momentum indicators. Structural risks tied to supply and past valuation remain part of the conversation, which keeps expectations grounded.
The next phase depends on whether demand continues to build as price explores higher levels. Watching how price behaves around resistance zones will offer clearer clues about whether this move develops into something larger or pauses to reset.
Disclaimer: The information on this page may come from third parties and does not represent the views or opinions of Gate. The content displayed on this page is for reference only and does not constitute any financial, investment, or legal advice. Gate does not guarantee the accuracy or completeness of the information and shall not be liable for any losses arising from the use of this information. Virtual asset investments carry high risks and are subject to significant price volatility. You may lose all of your invested principal. Please fully understand the relevant risks and make prudent decisions based on your own financial situation and risk tolerance. For details, please refer to
Disclaimer.
Related Articles
Bitcoin Tops $68K Briefly as Risk Sentiment Improves on Iran War Report
Bitcoin's price surged to $68,000 amid easing geopolitical tensions and improved investor sentiment. However, weak ETF inflows and extreme market fear signal a cautious outlook, indicating potential challenges to a sustained recovery.
LiveBTCNews3m ago
ETH 15-minute rise of 0.59%: ETF event expectations drive the intraday upward move
From 2026-03-31 13:45 to 14:00 (UTC), the ETH spot market recorded a +0.59% return. The price ranged from 2063.14 to 2079.88 USDT, with a volatility of 0.81%. During this period, market fluctuations slightly increased, activity became more prominent, and ETF-related events drew market attention. Traders’ sentiment focused on the upcoming capital flows associated with these events.
The main driver behind this movement was related to ETH ETF market developments. On March 31, 2026, regarding “Ethereum ETF Flo” (the original text is incomplete here, but the translation continues with the full content), the market reacted to the news and expectations surrounding the approval and launch of Ethereum ETFs, which influenced trading behavior and sentiment.
GateNews46m ago
Downside risk remains as bitcoin nears record-tying six-month losing streak
Bitcoin is nearing a record of six consecutive monthly losses, with declines in October, November, and December. While current support levels are holding, macroeconomic factors and ongoing conflicts pose risks to recovery.
CoinDesk1h ago
BTC Price Plunges to 3-Week Low as Analysts Map Out Next Downside Targets
The first breakdown to under $68,000 seemed as just the beginning for bitcoin’s Friday correction, which just worsened with another dip to a fresh 3-week low.
Most altcoins have followed suit, which has harmed over-leveraged traders, with more than 120,000 such participants being wrecked in the
CryptoPotato1h ago
Bitcoin Cash and NEAR Protocol lead CoinDesk 20 as the market trades sideways
Bitcoin Cash and NEAR Protocol emerged as leaders in the CoinDesk 20 index as the cryptocurrency market remained stagnant. While the index showed no significant movement, BCH increased by 1.5% and NEAR by 1.9%, indicating selective investor interest despite overall market caution.
TapChiBitcoin1h ago
ETH 15-minute price up 0.61%: Active buying comes in, and a breakout above a key level in tandem boosts short-term performance
2026-03-31 13:00 to 13:15 (UTC), ETH fluctuated within the 2047.63 to 2061.18 USDT range. The 15-minute candlestick return recorded +0.61%, with a range of 0.66%. During this period, market attention clearly increased; short-term long sentiment edged upward, volatility intensified, and it attracted incremental liquidity to enter.
The main drivers behind this anomaly are a slight uptick in on-chain trading volume and the emergence of aggressive buy orders. ETH’s on-chain average daily number of transactions remained at a high level of 2,000,000. In the window, spot market trading volume increased, and on-chain transfers accounted for a significant portion of the activity, reflecting increased market participation and liquidity inflows.
GateNews1h ago
