Hyperliquid (HYPE) is trading around the 25 USD mark at the time of writing on Monday, thus maintaining an increase of about 3% compared to the previous session. This perpetual contract exchange recorded a short term bounce back in the number of active users, although the total fees collected over the week have dropped to the lowest level since the beginning of the month. In the derivatives market, data shows a return of retail money flow, reflected in the increase in open positions on HYPE futures contracts, while the funding rate is leaning positively, reflecting investors' bullish expectations.
However, the technical picture of Hyperliquid is still not really clear. Selling pressure is showing signs of weakening, but the price bounce back may face many important resistance levels in the short term.
The interest of individual investors is increasing along with the bounce back of users.
Data from Artemis recorded the number of daily active users soaring to 13,800 on Friday, compared to 9,100 on December 6th. This development indicates signs of bounce back in the short term, although it still lies within the context of a prolonged declining trend. In the scenario where the cryptocurrency market stabilizes again soon, this recovery momentum could be reinforced, thereby promoting sustainable growth in user numbers and demand for the Hyperliquid platform.
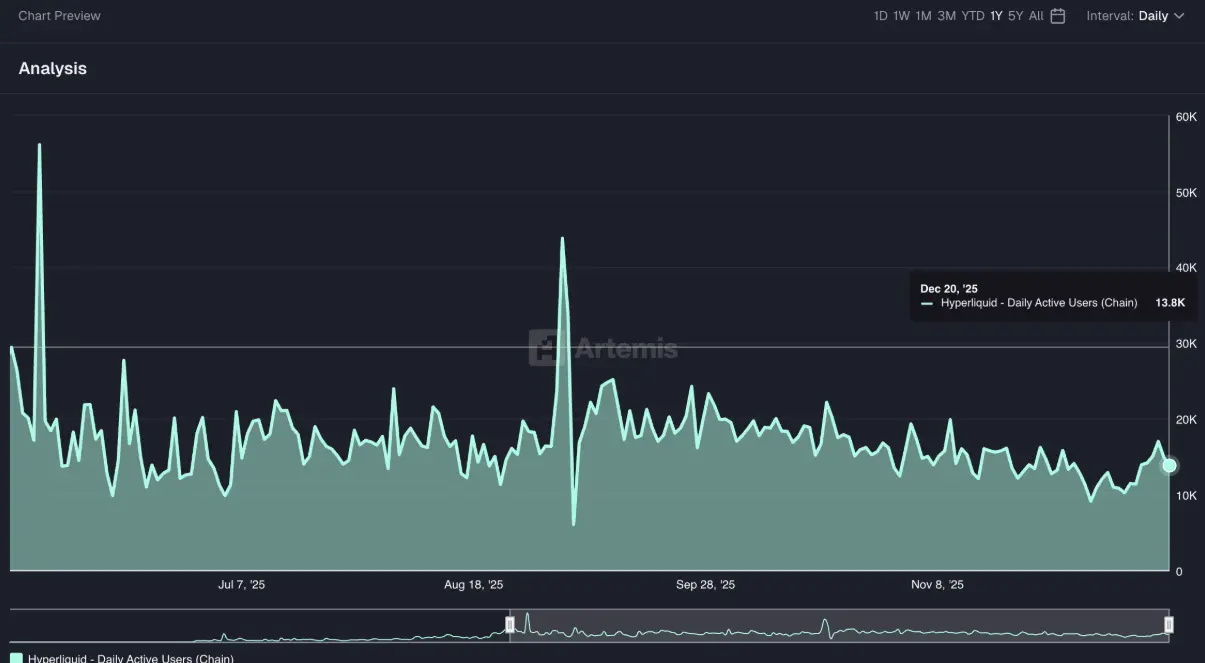 User activity data of Hyperliquid | Source: ArtemisOn the contrary, data from DeFiLlama shows that total transaction fees collected in the previous week only reached 16.11 million USD — the lowest weekly figure since the beginning of December. This figure reflects that, although user activity shows signs of recovery, the market's willingness to accept risk remains quite cautious, resulting in generated fees not being commensurate.
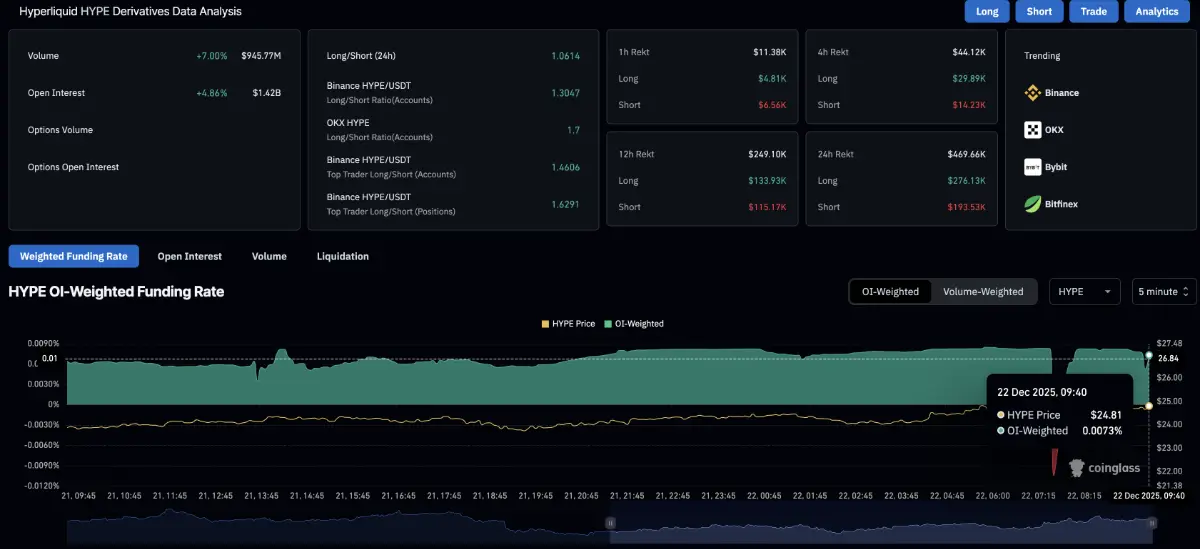
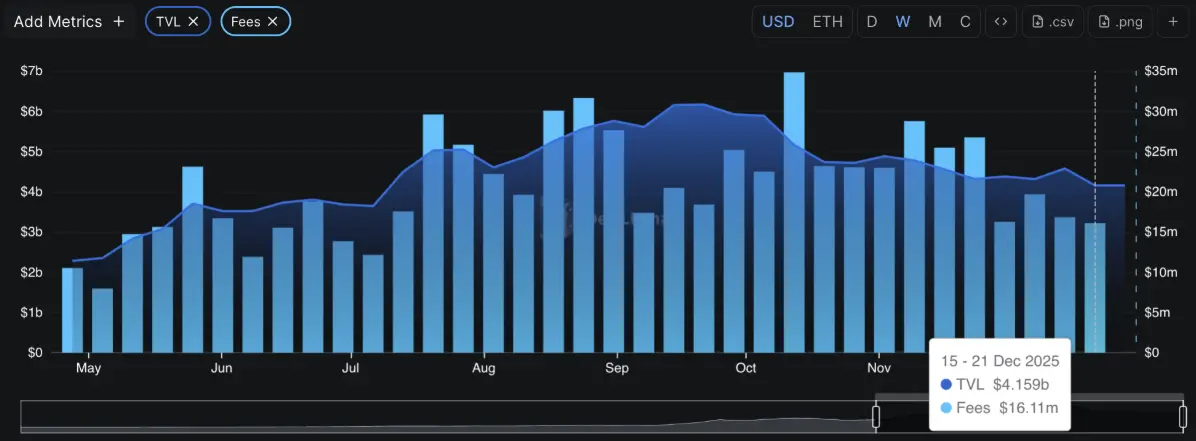 Data on transaction fees of Hyperliquid | Source: DeFiLlamaNotably, in the derivatives market, the interest of retail investors in the HYPE token is increasing significantly. According to CoinGlass, the open interest (OI) of HYPE futures contracts has reached 1.42 billion USD, up 4.86% in just 24 hours. At the same time, the funding rate remains at a positive 0.0073%, indicating that the bulls are in control, as traders are willing to pay fees to maintain Long positions, reflecting more optimistic expectations in the short term.
 Derivative data HYPE | Source: CoinGlass## Hyperliquid bounces back as selling pressure weakens
Hyperliquid (HYPE) is currently trading around the 25 USD mark at the time of writing on Monday, indicating a sideways accumulation state after a consecutive fall lasting 5 sessions last week. At the moment, the nearest resistance zone is identified at the Pivot S1 level around 26.03 USD, above which is the resistance trendline connecting the two peaks formed on 30/10 and 4/12, respectively around the 28.00 USD area.
In a positive scenario, if HYPE breaks decisively above the 28 USD threshold, the bullish momentum could be extended towards the 50-day exponential moving average (EMA) at 32.36 USD – an important technical milestone that could serve as a check on the short term trend.
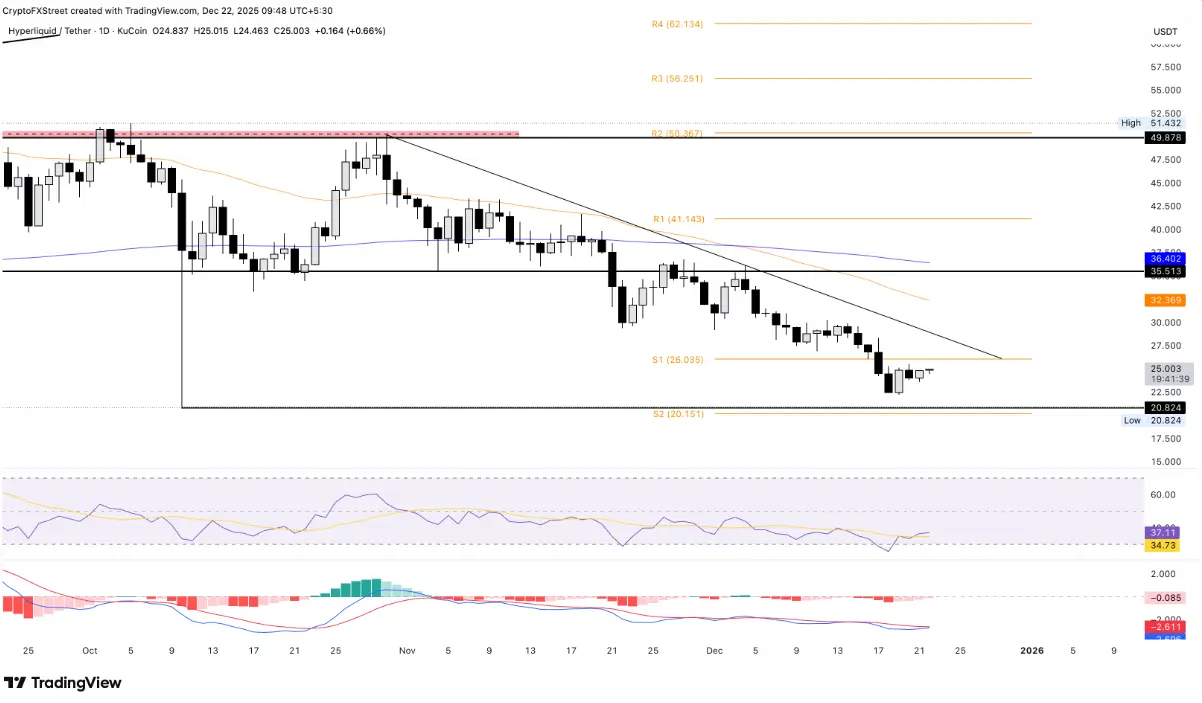 HYPE/USDT daily chart | Source: TradingViewThe technical signals on the daily timeframe are showing a noticeable weakening of selling pressure. The RSI is currently at 37 and trending upwards, reflecting the price gradually escaping the oversold zone. This development indicates that the previous selling force shows signs of exhaustion, thereby opening up the possibility of forming a short-term bounce back.
At the same time, the MACD line is approaching the signal line, implying the possibility of a bullish crossover in the near future. If confirmed, this will be a signal reinforcing the improvement of trend momentum.
On the contrary, in the case that selling pressure returns, HYPE may retreat to the important support zone ranging from the low of 10/10 to the Pivot S2 point, corresponding to the price range of 20.82 – 20.15 USD, where it is expected to trigger defensive buying pressure.
SN_Nour
Disclaimer: The information on this page may come from third parties and does not represent the views or opinions of Gate. The content displayed on this page is for reference only and does not constitute any financial, investment, or legal advice. Gate does not guarantee the accuracy or completeness of the information and shall not be liable for any losses arising from the use of this information. Virtual asset investments carry high risks and are subject to significant price volatility. You may lose all of your invested principal. Please fully understand the relevant risks and make prudent decisions based on your own financial situation and risk tolerance. For details, please refer to
Disclaimer.
Related Articles
Tensions around the Strait of Hormuz have been fluctuating, and Bitcoin falls below $74,000
The Strait of Hormuz blockade triggers a major shock in the crypto market: after Bitcoin first breaks above $78,000, it then falls back to $74,000, and the market remains in panic. This article provides an in-depth analysis of the transmission mechanism between geopolitical shocks and crypto market price action.
GateInstantTrends1h ago
Crypto Jack Warns Bitcoin May Drop to $48K Amid Geopolitical Tensions
Crypto trader Crypto Jack warns investors to sell Bitcoin, predicting a decline to $48,000 amidst US-Iran tensions and negative financial signals, before a potential recovery in May based on seasonal trends.
CryptoFrontier2h ago
Bitcoin’s fourth halving rally is slowing down, analysts say: BTC may have entered a “new normal”
Investment firm Galaxy analyst Alex Thorn noted that Bitcoin’s advance during this halving cycle has been lower than historical records, with volatility declining, and the market may be entering a new normal. Compared with the past three halvings, the fourth time’s price change is no longer significant. While the passage of U.S. spot ETFs has catalyzed the rally, the market’s ongoing conditions still need to be watched closely.
ChainNewsAbmedia2h ago
ETH jumps 1.22% in 15 minutes: DeFi segment activity and trading volume surge resonate to drive the move
2026-04-20 07:15 to 07:30 (UTC), ETH’s short-term return reached +1.22%. The price range spanned from 2285.19 to 2332.62 USDT, with a 2.07% amplitude. During this period, market attention heated up, volatility noticeably intensified. On-chain transaction volume rose in tandem, and key mainstream on-chain activity indicators expanded significantly on a month-over-month basis.
The primary driver of this deviation was an increase in transaction activity related to DeFi protocols, which boosted the share of on-chain Gas consumption. At the same time, total on-chain transaction volume saw a sharp surge in a short time. DeFi scenarios such as decentralized exchanges and lending protocols led to a direct surge in demand for ETH, driving funds to flow quickly into the market. In addition, the average Gas fees and Gas prices on the ETH network continued to climb in this window, further validating that high-frequency trading and active capital were accelerating into the market and strengthening short-term bullish sentiment.
Second, on-chain data also showed an expansion in liquidity related to stablecoins and ERC20 assets, strengthening market buy-side power. Although historical large-wallets such as Wilcke still held a large amount of ETH after early March, this cycle did not trigger abnormal transfers or large-scale sell-offs. Meanwhile, the positioning structure of mainstream ETH did not show passive deleveraging or concentrated liquidation. Under the combined effects of multiple factors, global buy-side demand was amplified, and short-term ETH volatility was further elevated.
Be alert to the risk of capital sustainability after a surge in high-frequency trading volume and Gas fees. If subsequent incremental buying is lacking or on-chain attention cools down, ETH may face short-term pullback pressure. Monitor changes in large-holder positions, any abnormal shifts in network fees, and liquidity volatility on the DeFi protocol chain. While there have been no signs of security incidents involving major contracts and protocols so far, short-term liquidity disturbances still need close observation. Keep monitoring fund flows and on-chain structure to stay informed about subsequent market changes.
GateNews2h ago
Bitcoin Dominance Approaches 59.9% Resistance, Altseason Signals Emerge
Bitcoin dominance has reached 59.9%, nearing a key resistance level. If rejected, analysts predict a capital shift to altcoins, potentially leading to an "altseason," as past trends show this often initiates rallies in smaller assets.
GateNews2h ago
BTC rises 0.58% in 15 minutes: whale large-capital transfers and derivatives defensive positioning drive spot buying
2026-04-20 06:30 to 2026-04-20 06:45 (UTC), the BTC price recorded a +0.58% return rate. The candlestick range was 74347.7 to 74898.0 USDT, with an amplitude of 0.74%. During this period, market attention increased because large orders and on-chain capital flow showed abnormal fluctuations, resulting in a higher overall volatility.
The main driver behind this anomalous move is whale entities concentrating large withdrawals and transfers targeting exchanges. Over the past 24 hours, the total reached 3,824 BTC, directly reducing the exchange’s BTC liquidity and bringing increased buy pressure to the spot market. On-chain data shows that the value of large transfers per transaction exceeding 1 million US dollars rose significantly during this window. As exchange immediate liquidity contracted, it pushed the BTC price upward in the short term. In addition, the derivatives market’s positioning structure changed: total futures open interest (OI) fell, and some defensive options positions shifted toward spot buying, further strengthening upside momentum.
Second, overall market liquidity remains in a fragile range. Order book data shows that large market buy orders were heavily concentrated, and buy-side depth increased noticeably. Meanwhile, in the same period, market Mempool activity and on-chain transaction fees were at low levels, and trading activity declined—making the impact of large single transfers and buy orders on price more pronounced. At the same time, leveraged funds leaving the derivatives market and options’ “maximum pain” strike price being below the spot price increased the spot market’s sensitivity to volatility. With multiple factors converging, the short-term upward price impulse was amplified.
Currently, market liquidity risk is rising, and in the short term the price is dominated by large buy orders in the order book and on-chain whale liquidity. Traders should continue to monitor the direction of whale capital flows and changes in exchange reserves, and be alert to possible price pullbacks caused by capital returning. At the same time, the key support range (72,000–74,000 USDT), order book depth, and derivatives positioning structure remain the core monitoring indicators for near-term volatility. Investors should be mindful of the risks stemming from fragile short-term liquidity and keep an eye on more real-time market developments.
GateNews3h ago
