Bitcoin has recently fallen from its historical high of $124,000 to the $109,000 range, which on the surface appears to be just a 10.5% decline, far below the typical pullback range of 28%-60% seen in past bull runs. However, the latest on-chain data analysis reveals that the market is brewing more severe structural issues internally—long-term holders are massively taking profits, institutional fund inflows are sharply decreasing, and the derivation market is accelerating its deleveraging. Do these hidden danger signals beneath the surface of prices indicate that a larger-scale adjustment is imminent?
Structural Weaknesses Under Surface Stability
The latest report released by Glassnode on September 25, ( https://insights.glassnode.com/the-week-onchain-week-38-2025/) pointed out that Bitcoin fell from nearly $117,000 after the Federal Reserve's interest rate cut decision, exhibiting a typical “buy the rumor, sell the news” pattern. However, the relatively mild pullback compared to the past conceals the deteriorating capital flow dynamics within the market.
This bull run cycle has absorbed a net inflow of up to 678 billion USD, nearly 1.8 times that of the previous bull run. This massive amount of capital has rapidly entered the market in a short period, creating an unprecedented liquidity environment, but at the same time, it has also buried the hidden danger of market overheating.
long-term holders take large profits
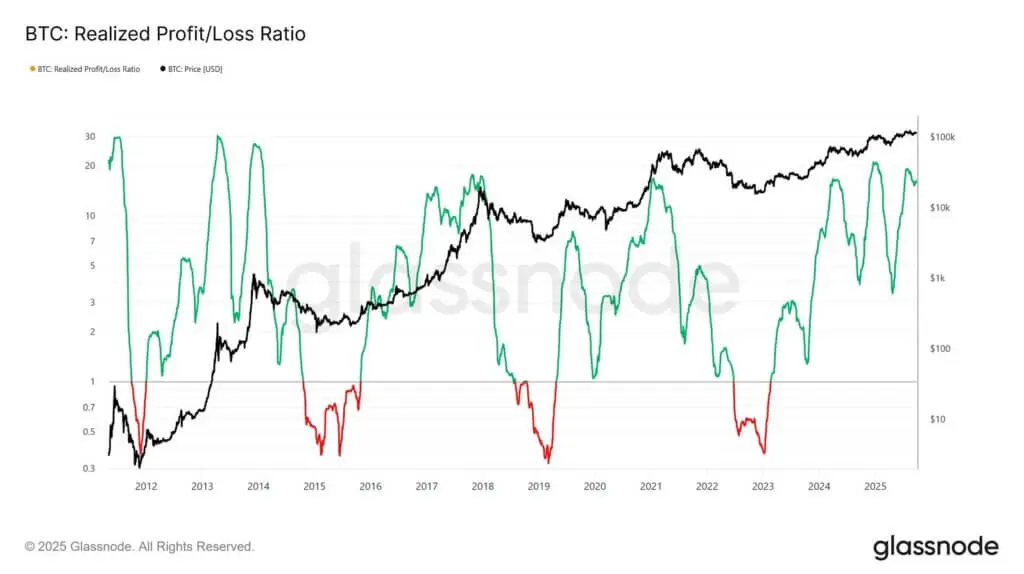
(Source: Glassnode)
On-chain data shows that long-term holders (addresses holding for more than 155 days) have allocated profits of 3.4 million Bitcoins, surpassing any previous bull run cycle levels. This data highlights the significant selling pressure from seasoned investors who are cashing out at the current high price levels.
The Realized Profit/Loss Ratio of Bitcoin reached an extreme level of over 10 in 2025. Historical data shows that when this indicator reaches such a high level, it usually means that profit-taking behavior dominates market activity, often accompanied by the formation of cyclical price tops.
Institutional demand cools and capital inflow interrupted
The Bitcoin spot ETF in the United States was a major driving force behind this year's bull run, but the latest data shows that this source of funding is rapidly drying up:
· The daily inflow of the ETF plummeted from the previous 2,600 BTC to nearly zero before and after the FOMC meeting.
· The allocation volume for long-term holders during the same period surged to 122,000 BTC per month.
This kind of supply and demand imbalance creates market vulnerability, laying the groundwork for a price pullback.
Market structure analysis shows that the balance between institutional demand and long-term holder distribution has been disrupted. Without new institutional capital inflows to offset the ongoing profit-taking of long-term holders, Bitcoin prices may face a greater risk of falling.
Derivation Market: Deleveraging Accelerates Pullback
The data from the derivation market further amplifies the fragility of the market. As Bitcoin fell below the critical support level of $113,000, the futures market experienced a massive wave of forced liquidations:
· The total amount of futures open interest dropped sharply from 44.8 billion USD to 42.7 billion USD.
· The intensive liquidation in the range of 112,000-114,000 USD triggered a chain reaction sell-off.
· Although the recent deleveraging reset has eliminated excess leverage, it has also exposed the market's high sensitivity to changes in liquidity.
The options market similarly reflects an increasing concern among investors regarding downside risk. The Put/Call Skew has surged from 1.5% to 17% after recent adjustments, indicating that market participants are actively hedging against downside risks.
The total amount of options open interest close to historical highs has generated the so-called “Gamma Overhang” effect, which will amplify market volatility, especially downside volatility, as most traders hold short gamma positions.
111,800 USD: Key Technical Support Level
On September 26, the trading price of Bitcoin was approximately $109,466, having fallen below the short-term holder's cost basis of $111,800. This price level had provided temporary support during the recent sell-off period, but it has now been broken.
From a technical perspective, the $111,000-$112,000 range has become a critical defense line for Bitcoin to avoid further falls. If the price cannot regain this level, it may trigger more short-term holders to stop-loss exit, further intensifying the selling pressure.
Key Factors for Market Balance
Bitcoin is currently in a tug-of-war between institutional accumulation and long-term holders taking profits. The following factors will determine the future price direction:
· Institutional capital inflow recovery: Whether ETF capital inflow can become active again is the key variable.
· Behavior of short-term holders: Stop-loss orders near the cost basis may trigger a pullback.
· Stability of the derivatives market: The leverage levels and sentiment changes in the futures and options markets.
· Macroeconomic Environment: Federal Reserve Policy Path and Dollar Index Trend
Investor Strategies
In the face of current market uncertainty, investors may consider the following strategies:
· Set a clear stop-loss level: Protect existing profits and avoid losses caused by deep pullbacks.
· DCA: If you are optimistic about the long-term prospects, you can buy in batches near key support levels.
·Focus on on-chain indicators: Continuously monitor the behavior of long-term holders and the flow of institutional funds.
· Reduce leverage exposure: Decrease the proportion of leveraged trading in a high volatility environment.
Conclusion: Is Healthy Integration or the Beginning of a Deep Adjustment?
The current pullback of Bitcoin may represent a healthy market consolidation or the beginning of a deeper cooling trend. The key lies in whether the support level at $111,000 can hold, as well as whether institutional capital inflow can recover to offset the ongoing distribution by long-term holders.
