Elevated open interest and ETF outflows left Bitcoin exposed to a rapid long liquidation cascade.
Bitcoin came under heavy selling at the U.S. market open, dropping $1,500 in about 20 minutes. Selling picked up quickly as buyers pulled back and long traders were forced to exit. However, market data suggest it was mainly a forced liquidation move, not widespread panic selling.
Bitcoin Drops 2.2% in Minutes as Long Liquidations Accelerate
On the 1-minute BTCUSDT chart shared by Ted Pillows, Bitcoin was trading around $68,300 to $68,400 before strong selling entered the market. Large red candles followed, sending the price down quickly to the $66,800–$66,900 area.
$BTC dropped $1,500 in just 20 minutes after the US market open.
The sellers are back. pic.twitter.com/Z9yUOLxgcP
— Ted (@TedPillows) February 17, 2026
Notably, this marked a 2.2% drop within a compressed window. At the same time, buyers provided little support as the market declined. More so, momentum reflected sustained market selling rather than a single volatility spike.
Liquidity data reveals a fragile structure before the breakdown. Liquidation heatmaps showed dense clusters above $68,500 and into $69,000–$70,000. Price failed to reach those upper pockets. Instead, it rotated lower into thinner bid zones.
Once $68,000 gave way, acceleration followed. Price moved through a liquidity vacuum, triggering forced long liquidations. Bitcoin’s fall to $66,800 happened where many long positions were likely to be liquidated below intraday support. In simple terms, too many traders were overexposed on the long side.
These trades were forced to close as prices declined. As those positions were liquidated, additional stop-loss orders were triggered. And this trend pushed the price down even faster.
Open interest data confirms the unwind. OI had remained elevated ahead of the session, reflecting heavy speculative positioning. During the sell-off, OI declined alongside the price. Price down with OI down signals long liquidation.
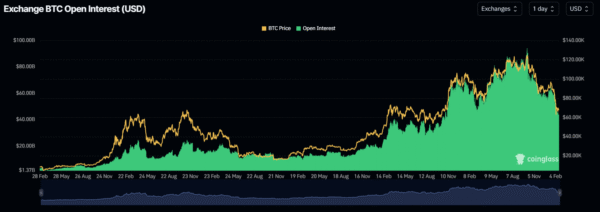
_Image Source: _CoinGlass
Fresh short positioning did not dominate the move. Overleveraged longs were forced to close. That dynamic explains the speed and vertical nature of the decline.
Funding rates add another layer of context. OI-weighted funding stayed persistently positive before the drop. In addition, traders were paying to maintain long exposure.
ETF Outflows and Elevated OI Leave BTC Vulnerable to Liquidations
Positive funding combined with high OI often creates structural fragility. When momentum stalls under those conditions, even modest volatility can trigger sharp squeezes. U.S. market open provided that volatility sparks.
Meanwhile, spot Bitcoin ETFs recorded notable net outflows on Feb. 12 and 11, totaling $410 million and $276 million. Feb. 13 saw only a modest $15 million inflow. Looking at the data, institutional demand appears to have slowed.
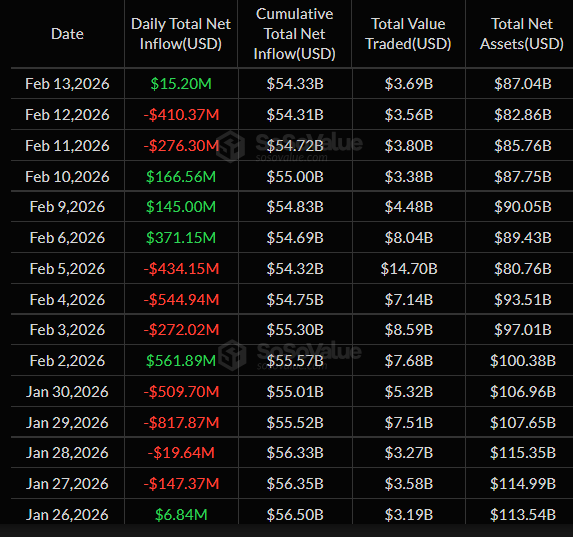
_Image Source: _SoSovalue
And with fewer strong spot buyers in the market, price drops are harder to absorb. As such, leveraged traders were left exposed when key support levels broke. Additionally, selling pressure increased rapidly.
Futures trading continues to dominate over options in the current market. As per data, most positions are concentrated in perpetual and futures contracts. Oftentimes, this setup increases the risk of sudden liquidation waves.
Disclaimer: The information on this page may come from third parties and does not represent the views or opinions of Gate. The content displayed on this page is for reference only and does not constitute any financial, investment, or legal advice. Gate does not guarantee the accuracy or completeness of the information and shall not be liable for any losses arising from the use of this information. Virtual asset investments carry high risks and are subject to significant price volatility. You may lose all of your invested principal. Please fully understand the relevant risks and make prudent decisions based on your own financial situation and risk tolerance. For details, please refer to
Disclaimer.
Related Articles
Bitcoin Enters Relief Phase of the Bear Market, Crypto Analyst Reveals Bottom Time Frame
Bitcoin enters relief phase of the bear market.
Crypto analyst reveals bottom price formation time frame.
Can the price of BTC hit one last ATH before the bottom forms?
The price of Bitcoin (BTC), the pioneer crypto asset, continues to trade under the $70,000 price range and is
CryptoNewsLand1m ago
Strategy Buys Another 4,871 Bitcoin As Saylor Confirms $329.9 Million Purchase
Strategy has added 4,871 Bitcoin to its holdings, totaling 766,970 BTC at an average cost of $75,644 each, funded by equity sales. Despite a substantial unrealized loss, the company maintains a commitment to Bitcoin as a core asset.
BlockChainReporter34m ago
Can Trump’s ultimatum to Iran push Bitcoin price back up to $75K?
Key takeaways:
Trump’s Tuesday deadline to Iran creates a pivotal moment for Bitcoin as it continues to decouple from gold.
While a ceasefire could boost equities, Bitcoin’s $75,000 path depends on its role as a hedge against fiscal instability.
BTC may benefit from (no) US-Iran ce
Cointelegraph35m ago
Africa’s cryptocurrency adoption skyrockets by 52%, with regulation and mobile payments accelerating the rapid spread of digital assets
Gate News updates: Africa’s cryptocurrency market is seeing rapid growth. According to Ripple’s latest report, the total on-chain transaction value in the region grew 52% year over year, a trend closely tied to more and more countries putting clear cryptocurrency regulatory rules in place. Countries such as South Africa, Nigeria, Kenya, and Mauritius are gradually bringing digital assets under financial supervision, giving businesses and users greater confidence and thereby boosting cryptocurrency adoption rates.
GateNews35m ago
