Key Takeaways
-
AAVE has dropped nearly 23% in 30 days, but price is now holding a major long-term support zone between $113–$129.
-
The weekly chart shows a potential double bottom pattern, signaling a possible trend reversal if support continues to hold.
-
A reclaim of the 100-week moving average near $137.8 could strengthen bullish momentum and open the path toward $378–$400 resistance.
The broader altcoin market has come under heavy selling pressure over the past few days, with sentiment deteriorating rapidly across major assets. Ethereum (ETH) has plunged more than 28%, setting the tone for the wider market. Unsurprisingly, Aave ($AAVE) hasn’t been spared, shedding nearly 23% over the past 30 days.
While short-term sentiment remains fragile, a closer look at AAVE’s weekly chart suggests price has now reached a technically important area — one that could serve as a foundation for a potential bounce if buyers continue to step in.
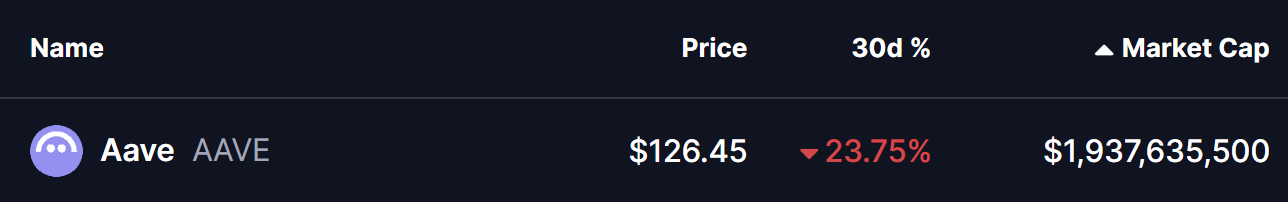
Source: Coinmarketcap
Double Bottom Pattern in Play?
On the weekly timeframe, AAVE appears to be forming a potential double bottom pattern, a classic bullish reversal structure that often develops near the end of prolonged downtrends.
The first bottom formed when AAVE dropped into the $113–$129 support zone, followed by a strong recovery attempt that pushed price toward the neckline resistance between $378 and $400. That rally ultimately faced rejection, but the latest sell-off has brought AAVE right back into the same support region.
What stands out this time is the buyer response. Price has once again stabilized within the $113–$129 zone, suggesting that bulls are actively defending this area and are not yet ready to give up control. The repeated defense of identical lows strengthens the case for this zone acting as a major accumulation region.
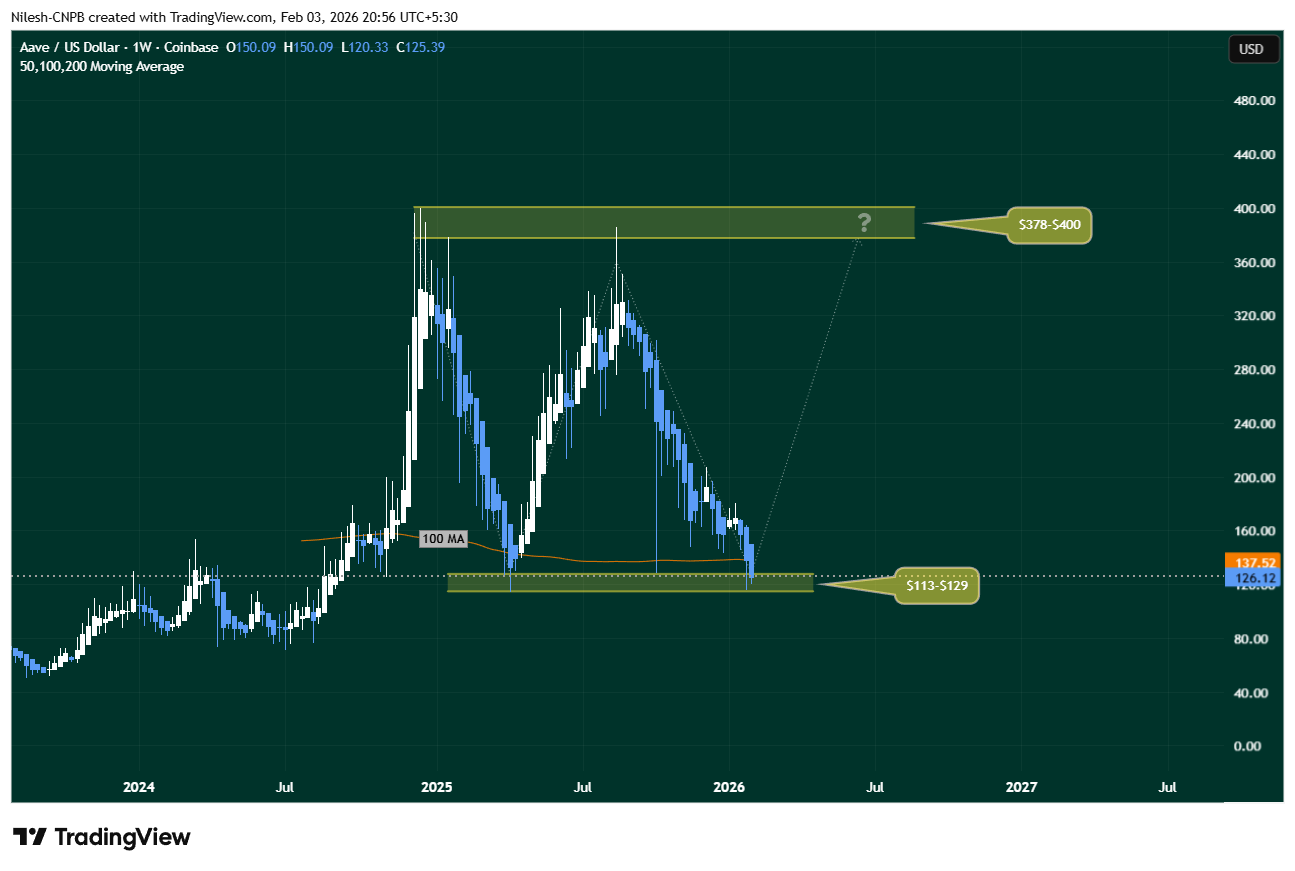
Aave ($AAVE) Weekly Chart/Coinsprobe (Source: Tradingview)
As long as AAVE continues to hold above this level, the broader double bottom structure remains technically valid.
What’s Next for AAVE?
For the bullish setup to gain traction, AAVE must hold the $113–$129 support zone and reclaim the 100-week moving average, currently sitting near $137.52. A sustained move above this level would signal improving momentum and mark an important shift in market structure.
If buyers manage to push price higher from here, the next major upside objective would be the neckline resistance at $378–$400. While that target may appear distant, a successful double bottom confirmation often leads to sharp recovery moves — especially if broader market conditions stabilize.
On the downside, the $113–$129 region remains the line in the sand. A decisive breakdown below this zone would invalidate the bullish setup and open the door to deeper downside risk.
Final Outlook
Despite recent weakness, AAVE’s technical structure remains constructive. The repeated defense of key support, the developing double bottom formation, and price hovering near the 100-week moving average suggest the token may be approaching a pivotal inflection point.
If accumulation continues and broader crypto sentiment improves, AAVE could be setting the stage for a meaningful recovery phase. Until then, all eyes remain on how price behaves around this critical support zone.
Disclaimer: The views and analysis presented in this article are for informational purposes only and reflect the author’s perspective, not financial advice. Technical patterns and indicators discussed are subject to market volatility and may or may not yield the anticipated results. Investors are advised to exercise caution, conduct independent research, and make decisions aligned with their individual risk tolerance.
About Author: Nilesh Hembade is the Founder and Lead Author of Coinsprobe, with over 5 years of experience in the cryptocurrency and blockchain industry. Since launching Coinsprobe in 2023, he has been providing daily, research-driven insights through in-depth market analysis, on-chain data, and technical research.
Disclaimer: The information on this page may come from third parties and does not represent the views or opinions of Gate. The content displayed on this page is for reference only and does not constitute any financial, investment, or legal advice. Gate does not guarantee the accuracy or completeness of the information and shall not be liable for any losses arising from the use of this information. Virtual asset investments carry high risks and are subject to significant price volatility. You may lose all of your invested principal. Please fully understand the relevant risks and make prudent decisions based on your own financial situation and risk tolerance. For details, please refer to
Disclaimer.
Related Articles
Is the XRP Bottom Finally Here? 3 Massive Bullish Signals You Need to See
Although in a more modest manner, XRP whales have returned to the scene, amassing more tokens over the past week, which is categorized as the first bullish sign for the underlying asset.
Another could come in the form of the technical tool used to determine whether that asset’s move in either
CryptoPotato10m ago
Bitcoin’s Most Dangerous Pattern Just Triggered: Will BTC Dump to $26K Next?
Although bitcoin has already dumped by over 50% from its all-time high of over $126,000 marked in October to a multi-year low of $60,000, the asset’s troubles might not be over, warned Merlijn The Trader.
The popular analyst indicated that the “most dangerous bitcoin pattern just completed phase
CryptoPotato17m ago
Ethereum (ETH) on the Edge: Critical Level Stands Between New Bull Run and a Major Crash
While the second-largest cryptocurrency has registered a significant rebound over the past month, it remains at risk of plummeting to drastically low levels during this cycle.
On the other hand, some important indicators suggest that the worst might be over and the price could be gearing up for a m
CryptoPotato1h ago
Dogecoin (DOGE) Mini Cycles Are Repeating – Here’s Where the Price Could Go Next
DOGE's price is currently in a critical phase, trapped in a descending triangle, testing support at $0.0886. Analysts suggest potential for either a bounce toward $0.1050 or a drop to $0.0820. The path ahead depends on reclaiming higher ranges to continue its cyclical pattern of accumulation and breakout.
CaptainAltcoin1h ago
Bittensor (TAO) Is Up 140% in 6 Weeks, But Data Shows Retail Is Missing the Big AI Rally
Bittensor has recorded a 140% price increase over the past six weeks, including a 105% rise since March 8.
The latest price action has pushed it to the 26th-largest cryptocurrency by market capitalization, according to new data from Santiment.
AI Tokens Heat Up
-----------------
The rally comes a
CryptoPotato3h ago
Bitcoin Historical Data Suggests April Could Break the Current Q-1 Market Stagnation
The cryptocurrency market is nearing the end of the first quarter of 2026 and is in a unique position of stability. Unlike the past where BTC experienced extreme price swings; in March BTC has been flat and rather like what transpired in this same month one year ago, with analyst Daan Crypto
BlockChainReporter3h ago
