
Key Takeaways
-
SUI has dropped nearly 67% from its recent peak, placing it in a potential bottoming zone.
-
Current price action closely mirrors Solana’s 2025 bottoming fractal, which preceded a strong reversal.
-
A reclaim of the 50-day moving average could confirm a trend shift and open the door for a broader recovery.
SUI, the native token of Sui’s Layer-1 blockchain, has struggled to live up to its early hype in recent months, especially when compared to** Solana’s (SOL)** 2021 explosive performance. A broader market correction has only added pressure, dragging SUI nearly 50% lower over the past 90 days.
But zooming out and looking beneath the surface, the current price structure tells a more interesting story. On the charts, SUI is starting to resemble a bottoming fractal previously seen in Solana—a setup that eventually led to a sharp and sustained upside move.
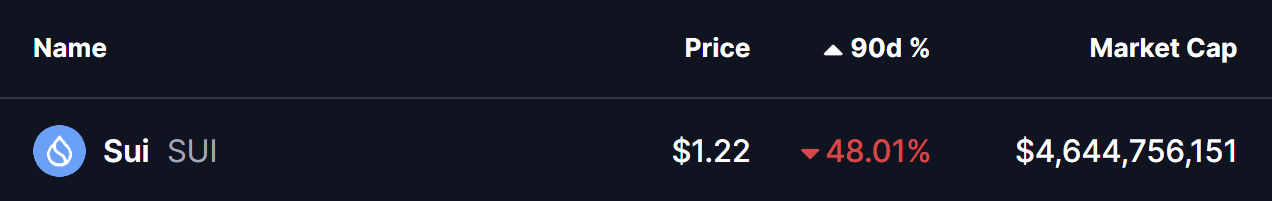
Source: Coinmarketcap
SUI Mirrors SOL’s Bottoming Path
A side-by-side comparison of SUI and SOL reveals striking similarities.
Back in early 2025, **Solana **topped near $295 before entering a sharp corrective phase. Price slipped below the 50-day moving average, signaling weakening momentum. The sell-off eventually stretched into a deep 67% drawdown, flushing out late longs and marking a clear sentiment reset.
That low proved pivotal.
Once SOL reclaimed its 50-day moving average, the trend structure flipped. What followed was a 163% rally, one of the most notable reversals of 2025.
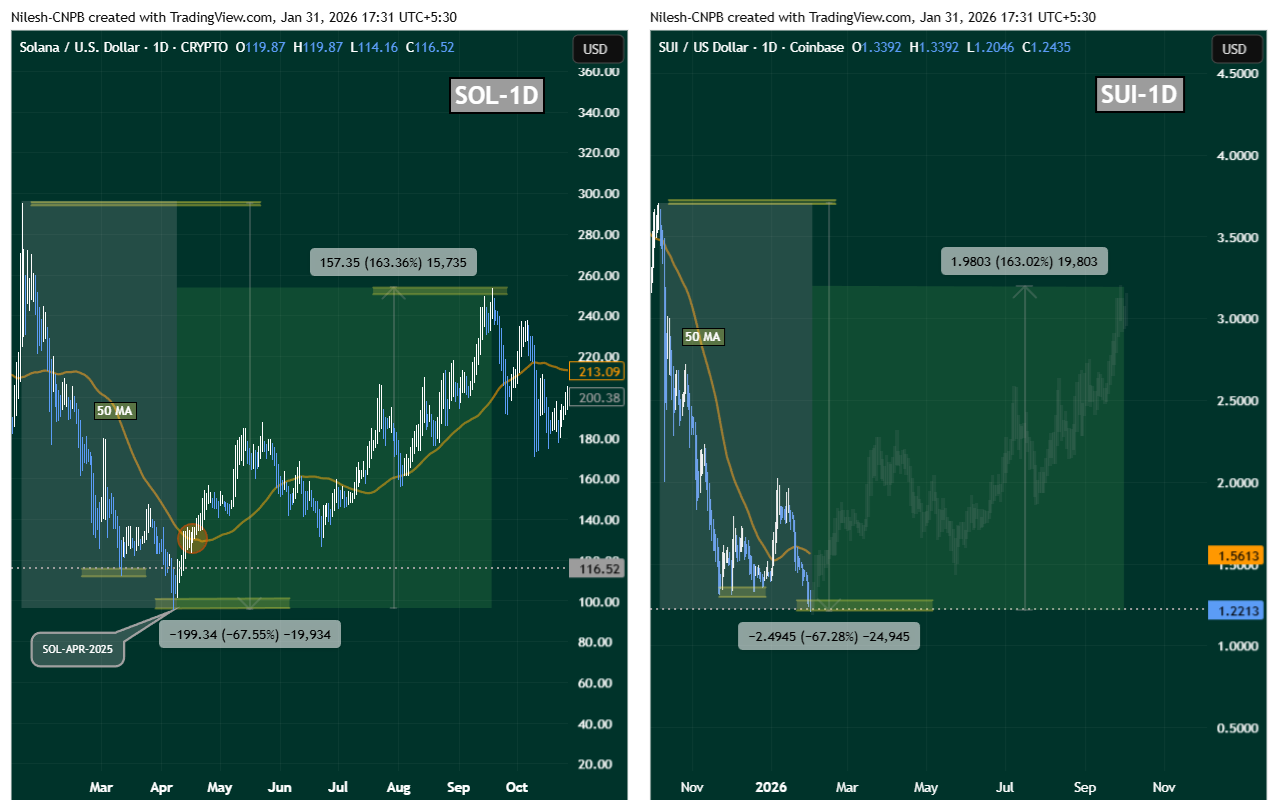
SOL and SUI Fractal Chart/Coinsprobe (Source: Tradingview)
SUI now appears to be following a similar script.
After peaking around $3.70 in October 2025, SUI entered a steep correction, losing its 50-day moving average and sliding into a nearly identical 67% drawdown. Momentum faded, volatility compressed, and price action began to flatten—classic characteristics of a market searching for a base.
What’s Next for SUI?
From a technical perspective, SUI is now sitting near a critical inflection zone around $1.20–$1.22, an area that could act as a potential bottom if buyers continue to defend it.
The first major confirmation bulls will want to see is a reclaim of the 50-day moving average, currently hovering near $1.56. A sustained move above this level would signal that bearish momentum is fading and that buyers are regaining control.
If that reclaim occurs, SUI could transition into a broader recovery phase. In a scenario where the SOL fractal continues to play out, upside expansion toward the $3.00–$3.20 region would come back into focus over the medium term.
Key Risk Note
While fractal comparisons can offer valuable context, they are not guarantees. Each asset trades within its own liquidity environment, sentiment cycle, and macro backdrop. For SUI, confirmation still matters—especially through moving average reclaims and consistent follow-through buying.
Until then, the structure suggests risk is compressing, not expanding.
Disclaimer: The views and analysis presented in this article are for informational purposes only and reflect the author’s perspective, not financial advice. Technical patterns and indicators discussed are subject to market volatility and may or may not yield the anticipated results. Investors are advised to exercise caution, conduct independent research, and make decisions aligned with their individual risk tolerance.
About Author: Nilesh Hembade is the Founder and Lead Author of Coinsprobe, with over 5 years of experience in the cryptocurrency and blockchain industry. Since launching Coinsprobe in 2023, he has been providing daily, research-driven insights through in-depth market analysis, on-chain data, and technical research.
Disclaimer: The information on this page may come from third parties and does not represent the views or opinions of Gate. The content displayed on this page is for reference only and does not constitute any financial, investment, or legal advice. Gate does not guarantee the accuracy or completeness of the information and shall not be liable for any losses arising from the use of this information. Virtual asset investments carry high risks and are subject to significant price volatility. You may lose all of your invested principal. Please fully understand the relevant risks and make prudent decisions based on your own financial situation and risk tolerance. For details, please refer to
Disclaimer.
Related Articles
Solana Holds Key Support as Range Tightens Below $90
Key Insights
Solana trades near $80 support as price compresses within a tight range, reflecting reduced volatility and balanced market participation among traders.
Persistent lower highs and price below major moving averages confirm ongoing bearish structure, limiting recovery attempts
CryptoNewsLand8m ago
BTC 15-minute rise of 0.45%: driven by routine trading, with moderately resonating macro hedging sentiment
From 2026-04-07 15:15 to 15:30 (UTC), Bitcoin (BTC) recorded a +0.45% return. The price moved slightly upward within the USDT range of 67,886.0 to 68,199.5, with an amplitude of 0.46%. During this period, market attention increased somewhat, but overall volatility remained within the normal range, and no unusual market fluctuations appeared.
The main driving force behind this anomaly was routine trading activity in the spot market. On-chain data shows that the number of active addresses in the 15-minute window was about 66,000, slightly higher than the previous period. In the same period, spot trading volume increased by about 0.5 from the previous period over period
GateNews22m ago
Schwab says even a 1% crypto allocation can reshape portfolio risk
Charles Schwab's research highlights that cryptocurrency allocation in portfolios relies more on investors' risk tolerance than return forecasts. With high volatility, even small crypto allocations can significantly affect portfolio risk, though they remain speculative investments.
CoinDesk1h ago
BTC 15-minute drop of 0.51%: short-term capital outflow and macro volatility converging to trigger a pullback
Between 2026-04-07 14:00 and 2026-04-07 14:15 (UTC), the BTC price fluctuated within the range of 67801.3 - 68256.1 USDT. The candlestick chart recorded a -0.51% return, with an amplitude of 0.67%. Short-term volatility intensified, and market attention increased significantly. Overall liquidity was still within the normal range, but showed marginal changes.
The main drivers of this unusual move are the combined effect of short-term capital outflows and the simultaneous rise in net inflows to exchanges. Short-term holders take profit or cut losses at market volatility nodes, pushing prices lower. Spot
GateNews1h ago
'A whole civilization will die': Crypto markets under pressure as Trump ups rhetoric towards Iran
Bitcoin has fallen to around $68,000 after hitting over $70,000, coinciding with Trump's Iran deadline. U.S. stock futures also declined, while oil prices rose. Vance's comments tempered market reactions, stating military goals in Iran were met.
CoinDesk2h ago
Analyst Says Five Years of Nothing for Ethereum and Altcoin Will Finally End Soon
Analyst says five years of nothing for Ethereum and altcoins will end soon.
This means the altseason peak phase is nearing.
How far can the price of ETH pump this year?
Expectations for altseason to play out this year remain strong despite the many calls for the bear market to have
CryptoNewsLand3h ago
