
Key Takeaways
-
Algorand (ALGO) is consolidating after a 13% decline over the past 60 days, while showing stabilization in the last month.
-
The daily chart reveals a repeating bullish fractal, similar to the setup that triggered ALGO’s 300% rally in November 2024.
-
Price is holding inside a long-term accumulation zone between $0.11 and $0.1530.
-
The 200-day moving average near $0.1912 is acting as key resistance and breakout confirmation level.
-
A successful reclaim of the 200 MA could open the path toward $0.60 and the ascending resistance trendline, while a drop below $0.11 would invalidate the bullish setup.
ALGO, the native token of Algorand’s Layer-1 blockchain, has shown steady but muted momentum over the past 30 days, helping slow down its broader correction. Despite this stabilization, ALGO remains down more than 13% over the last 60 days, keeping sentiment cautious across the market.
That said, when looking beyond short-term price noise, the daily chart is beginning to tell a familiar story. The current structure closely resembles a bullish fractal that, in the past, preceded a powerful breakout rally—raising an important question for traders: is this just consolidation, or a quiet accumulation phase before the next move?
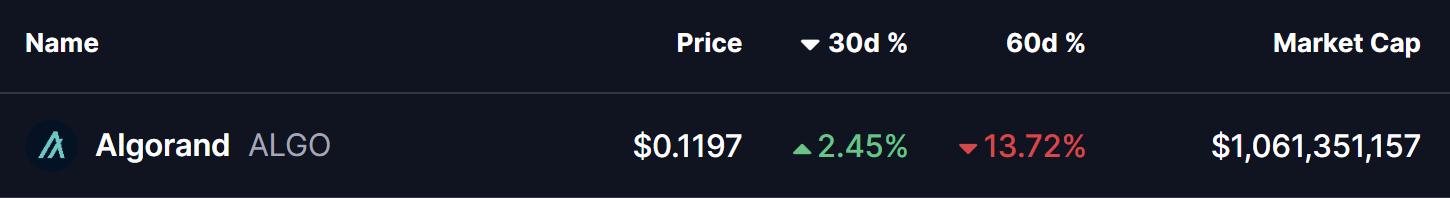
Source: Coinmarketcap
Fractal Setup Hints at a Bullish Reversal
On the daily timeframe, ALGO is displaying early signs of a repeating bullish structure, built around three key technical elements:
-
A rejection from the long-term ascending resistance trendline
-
A prolonged accumulation zone at major historical support
-
A potential reclaim of the 200-day moving average
The current corrective phase began in December 2024, when ALGO was rejected near the ascending resistance trendline around $0.60. That rejection triggered a deep pullback of more than 80%, eventually driving price back into the long-term demand zone between $0.11 and $0.1530—a region that has repeatedly acted as an accumulation area on the chart.
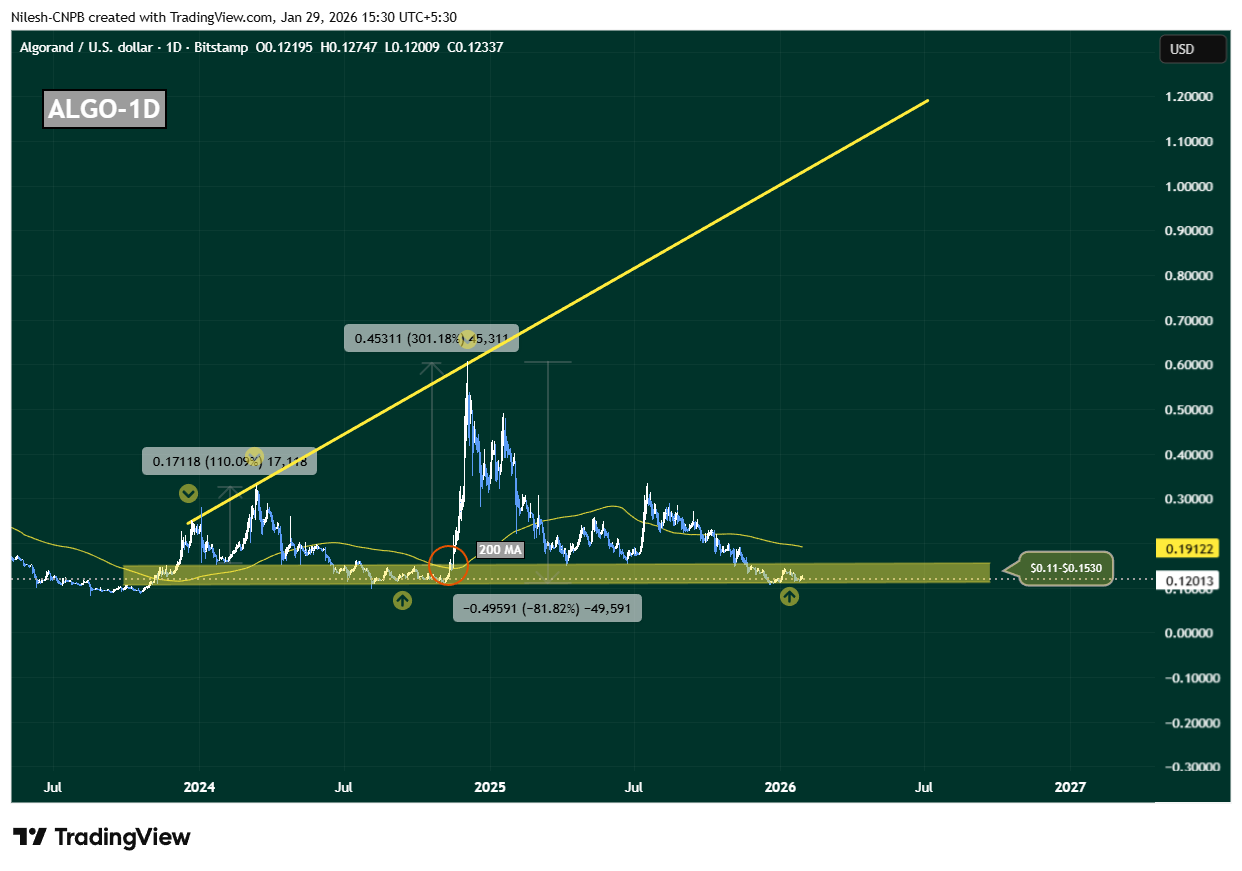
Algorand (ALGO) Daily Chart/Coinsprobe (Source: Tradingview)
This zone is not just technically important; it has also served as a launchpad during previous cycles, where downside momentum stalled and long-term buyers quietly stepped in.
History Rhymes on the ALGO Chart
What makes this setup particularly compelling is how closely it mirrors November 2024’s breakout structure. Back then, ALGO spent extended time consolidating near the same support band before reclaiming the 200-day moving average. Once that level flipped into support, price accelerated sharply—resulting in a 300% rally toward the ascending resistance trendline.
Today, ALGO is once again compressing inside this accumulation range, while the 200-day moving average sits overhead near $0.1912, acting as dynamic resistance. This alignment suggests the market may be approaching another inflection point.
What’s Next for ALGO?
At present, ALGO is hovering near $0.12, firmly inside its long-term accumulation zone. As long as price holds above this region, the broader bullish fractal remains intact.
A clean and sustained reclaim of the 200-day moving average around $0.1912 would be a critical confirmation signal. If bulls manage to flip this level into support, it would closely replicate previous breakout conditions and could trigger a sharp upside expansion. In that scenario, $0.60 becomes a realistic medium-term target, with further upside possible toward the ascending resistance trendline if momentum builds.
However, the structure is not without risk. A decisive breakdown below $0.11 would weaken the accumulation thesis, signal loss of long-term support, and open the door for deeper downside.
For now, ALGO sits at a make-or-break zone. The chart suggests patience is key—but if history repeats, this quiet phase may not last much longer.
Disclaimer: The views and analysis presented in this article are for informational purposes only and reflect the author’s perspective, not financial advice. Technical patterns and indicators discussed are subject to market volatility and may or may not yield the anticipated results. Investors are advised to exercise caution, conduct independent research, and make decisions aligned with their individual risk tolerance.
About Author: Nilesh Hembade is the Founder and Lead Author of Coinsprobe, with over 5 years of experience in the cryptocurrency and blockchain industry. Since launching Coinsprobe in 2023, he has been providing daily, research-driven insights through in-depth market analysis, on-chain data, and technical research.
Disclaimer: The information on this page may come from third parties and does not represent the views or opinions of Gate. The content displayed on this page is for reference only and does not constitute any financial, investment, or legal advice. Gate does not guarantee the accuracy or completeness of the information and shall not be liable for any losses arising from the use of this information. Virtual asset investments carry high risks and are subject to significant price volatility. You may lose all of your invested principal. Please fully understand the relevant risks and make prudent decisions based on your own financial situation and risk tolerance. For details, please refer to
Disclaimer.
Related Articles
Solana Holds Key Support as Range Tightens Below $90
Key Insights
Solana trades near $80 support as price compresses within a tight range, reflecting reduced volatility and balanced market participation among traders.
Persistent lower highs and price below major moving averages confirm ongoing bearish structure, limiting recovery attempts
CryptoNewsLand8m ago
BTC 15-minute rise of 0.45%: driven by routine trading, with moderately resonating macro hedging sentiment
From 2026-04-07 15:15 to 15:30 (UTC), Bitcoin (BTC) recorded a +0.45% return. The price moved slightly upward within the USDT range of 67,886.0 to 68,199.5, with an amplitude of 0.46%. During this period, market attention increased somewhat, but overall volatility remained within the normal range, and no unusual market fluctuations appeared.
The main driving force behind this anomaly was routine trading activity in the spot market. On-chain data shows that the number of active addresses in the 15-minute window was about 66,000, slightly higher than the previous period. In the same period, spot trading volume increased by about 0.5 from the previous period over period
GateNews22m ago
Schwab says even a 1% crypto allocation can reshape portfolio risk
Charles Schwab's research highlights that cryptocurrency allocation in portfolios relies more on investors' risk tolerance than return forecasts. With high volatility, even small crypto allocations can significantly affect portfolio risk, though they remain speculative investments.
CoinDesk1h ago
BTC 15-minute drop of 0.51%: short-term capital outflow and macro volatility converging to trigger a pullback
Between 2026-04-07 14:00 and 2026-04-07 14:15 (UTC), the BTC price fluctuated within the range of 67801.3 - 68256.1 USDT. The candlestick chart recorded a -0.51% return, with an amplitude of 0.67%. Short-term volatility intensified, and market attention increased significantly. Overall liquidity was still within the normal range, but showed marginal changes.
The main drivers of this unusual move are the combined effect of short-term capital outflows and the simultaneous rise in net inflows to exchanges. Short-term holders take profit or cut losses at market volatility nodes, pushing prices lower. Spot
GateNews1h ago
'A whole civilization will die': Crypto markets under pressure as Trump ups rhetoric towards Iran
Bitcoin has fallen to around $68,000 after hitting over $70,000, coinciding with Trump's Iran deadline. U.S. stock futures also declined, while oil prices rose. Vance's comments tempered market reactions, stating military goals in Iran were met.
CoinDesk2h ago
Analyst Says Five Years of Nothing for Ethereum and Altcoin Will Finally End Soon
Analyst says five years of nothing for Ethereum and altcoins will end soon.
This means the altseason peak phase is nearing.
How far can the price of ETH pump this year?
Expectations for altseason to play out this year remain strong despite the many calls for the bear market to have
CryptoNewsLand3h ago
