
Key Takeaways
-
HBAR is down over 26% in 30 days, under heavy altcoin selling pressure.
-
Price has lost the 100-week MA, signaling weakening momentum.
-
HBAR’s structure closely mirrors CRO’s 2024 bearish fractal.
-
A breakdown below $0.084 could expose $0.041 as the next major support.
-
Reclaiming $0.1547 would invalidate the bearish fractal setup.
The broader altcoins crypto market has faced strong selling pressure over the past 30 days, with Ethereum (ETH) sliding more than 28%, keeping pressure firmly on major altcoins.
Among them, Hedera (HBAR) has been particularly weak — dropping over 13% in the past week and extending its 30-day decline beyond 26%. What’s catching traders’ attention now is a familiar fractal pattern from Cronos (CRO), which suggests HBAR may be setting up for a deeper downside move in the near term.
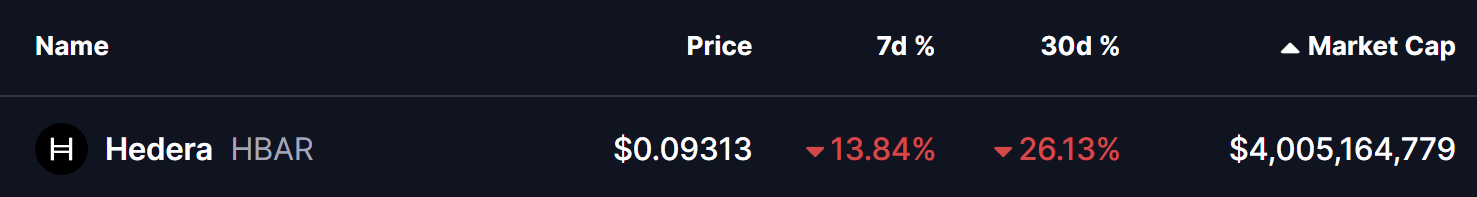
Source: Coinmarketcap
Fractal Setup Hints at Further Downside
A side-by-side comparison of CRO and HBAR reveals striking similarities.
Back in late 2024, Cronos broke out from a falling wedge and staged a strong rally — only to roll over shortly after. Price slipped below the 100 moving average, signaling weakening momentum. What followed was a sharp corrective phase that eventually dragged CRO into its accumulation support zone, completing a deep drawdown.
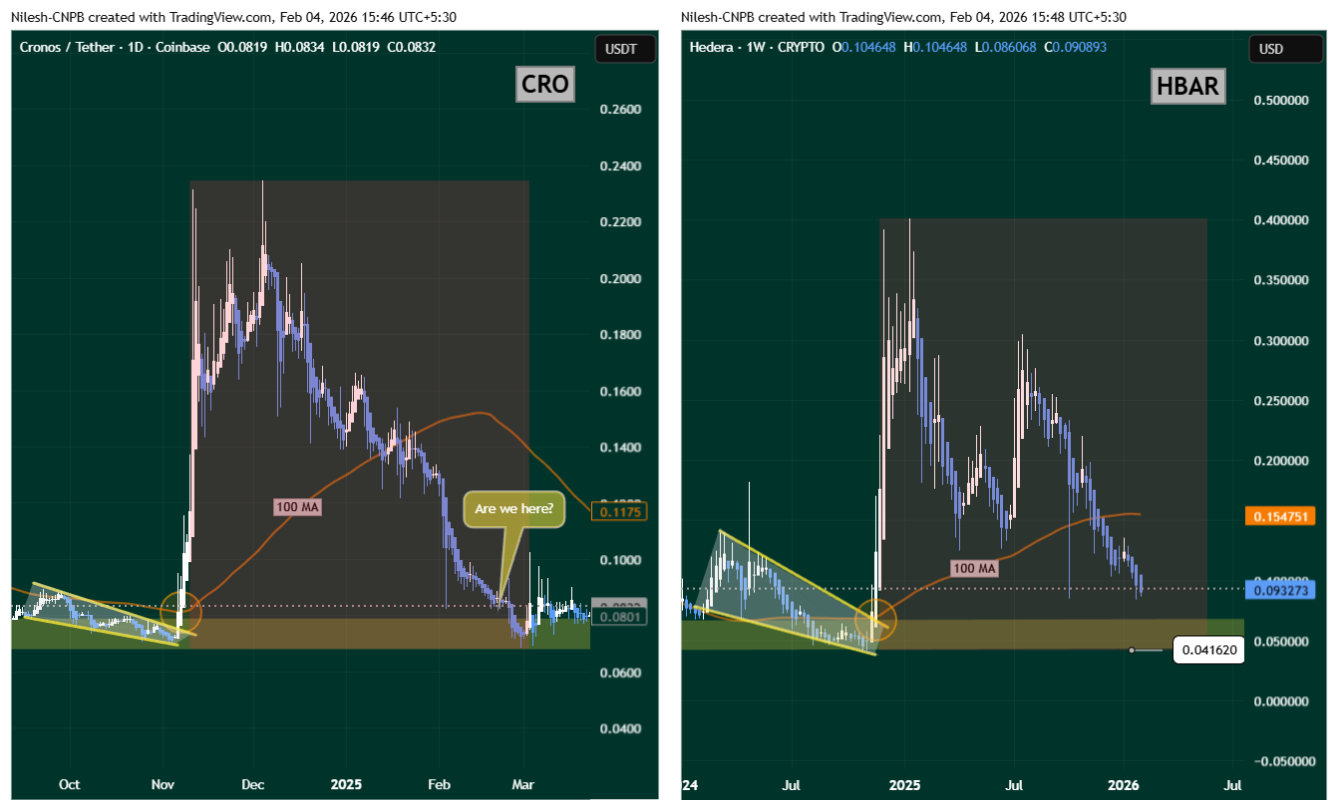
CRO and HBAR Fractal Chart/Coinsprobe (Source: Tradingview)
HBAR now appears to be following a very similar script.
After its own falling wedge breakout rally, Hedera entered a steep correction. Price has since lost the 100-week moving average and is now pressing into the $0.084 support area, closely aligning with CRO’s final stage correction before its deeper drop.
With this fractal lining up almost point-for-point, the technical picture suggests bearish momentum is still in control.
Moving averages are rolling over, structure is weakening, and buyers are struggling to reclaim higher levels — all classic signs of a market still searching for a durable bottom.
What’s Next for HBAR?
If this fractal continues to play out, a clean breakdown below the $0.084 support could open the door for a move toward the deeper accumulation zone near $0.041 over the coming weeks.
That would mirror CRO’s historical decline after it lost key moving averages and failed to hold its initial support.
On the flip side, bulls still have a chance to invalidate this bearish setup.
A strong reclaim of the 100-week moving average near $0.1547 would be an early signal that momentum is shifting back in HBAR’s favor — and that this CRO-style fractal may fail.
For now, however, the weekly structure keeps HBAR technically vulnerable. Until major resistance levels are recovered, the path of least resistance remains tilted to the downside, with traders closely watching whether this familiar fractal plays out once again.
Disclaimer: The views and analysis presented in this article are for informational purposes only and reflect the author’s perspective, not financial advice. Technical patterns and indicators discussed are subject to market volatility and may or may not yield the anticipated results. Investors are advised to exercise caution, conduct independent research, and make decisions aligned with their individual risk tolerance.
About Author: Nilesh Hembade is the Founder and Lead Author of Coinsprobe, with over 5 years of experience in the cryptocurrency and blockchain industry. Since launching Coinsprobe in 2023, he has been providing daily, research-driven insights through in-depth market analysis, on-chain data, and technical research.
Disclaimer: The information on this page may come from third parties and does not represent the views or opinions of Gate. The content displayed on this page is for reference only and does not constitute any financial, investment, or legal advice. Gate does not guarantee the accuracy or completeness of the information and shall not be liable for any losses arising from the use of this information. Virtual asset investments carry high risks and are subject to significant price volatility. You may lose all of your invested principal. Please fully understand the relevant risks and make prudent decisions based on your own financial situation and risk tolerance. For details, please refer to
Disclaimer.
Related Articles
Bitcoin’s implied volatility drops to an intra-year low, and the market is reacting mildly to Friday’s CPI data
April 9, U.S. March CPI data will be released on April 11. The market expects the year-over-year rate to rise from 2.4% to 3.4%. The Bitcoin market has responded calmly, with the options market’s volatility range only at 2.5%. Attention has been drawn by the rise in gasoline prices. Analysts believe that CPI data coming in either too soft or too hot will have different impacts on the crypto market.
GateNews24m ago
XRP Stabilizes Near Key Levels Amid Fed Pressure and Rule Shift
Key Insights
XRP stabilized near $1.31 as macroeconomic pressures and declining liquidity combined to limit recovery momentum and increase short-term volatility risks significantly.
Proposed stablecoin regulations favor utility models, positioning RLUSD for growth while reducing incentives t
CryptoNewsLand25m ago
XRP Today’s News: Institutional funds return, circulating inflow of 120 million exceeds Bitcoin
This week, XRP recorded a $119.6 million capital inflow, setting the highest mark since 2025 and becoming a major beneficiary in the crypto market. This round of funds returning was mainly driven by greater clarity in regulatory policy and XRP’s real-world use in cross-border payment infrastructure. Technically, it shows an initial recovery, but overall it is still in a downward channel. The support and resistance levels are $1.31 and $1.40, respectively; if it breaks through, it is expected to reach $1.50.
MarketWhisper2h ago
XRP drops to $1.33, with $3.32 million in ETF inflows still failing to reverse the downtrend; the key support to watch is $1.28
In April 2026, the XRP price pulled back to $1.33, down about 4%. Although there was capital inflow into Ripple-related products, selling pressure dominated the market, and increased trading volume signaled distribution. Declining liquidity further heightens volatility risk; watch the $1.33 support—if it breaks, prices will likely fall further. For a short-term rebound, it needs to break above $1.35; otherwise, it should remain in a weak range-bound consolidation.
GateNews3h ago
XRP Price Structure Signals More Downside — Key Levels to Watch
XRP fails to make new highs, confirming bearish market structure remains intact.
Price targets $1.13, $1.08, and potentially $0.87 support levels.
Traders should wait for confirmation instead of reacting to short-term price moves.
Short bursts of green candles can quickly shift market
CryptoNewsLand3h ago
Bitcoin is hovering around the $700,000 level; if oil prices fall below $100 or push toward $80,000
Bitcoin has recently been trading in a high-level range. The price rebounded from $67,000 to $70,900, driven by a U.S.-Iran ceasefire agreement. Market analysis suggests that weakness in oil prices—or easing inflation pressure—may support Bitcoin’s upside. If it breaks above $72,500, it could trigger short liquidations and push the price up to $80,000. However, instability in the Middle East and a rebound in oil prices could act as a drag. Volatility in the energy market will be a key factor influencing Bitcoin’s direction.
GateNews3h ago
