
Key Takeaways
-
Hyperliquid’s HIP-3 markets hit record highs, with daily trading volume surging to around $1.47 billion.
-
Open interest (OI) reached an all-time high of $793 million, up sharply from $260 million just a month ago.
-
Rising commodities trading activity is driving strong capital inflows into the Hyperliquid ecosystem.
-
The daily chart highlights a Bearish Shark harmonic pattern, allowing room for short-term upside.
Hyperliquid’s native token HYPE is back in focus after posting a sharp 20%+ rally, pushing price toward the $26.80 level. While the move itself has caught traders’ attention, a closer look at on-chain growth and chart structure suggests this momentum may be backed by more than just short-term speculation.
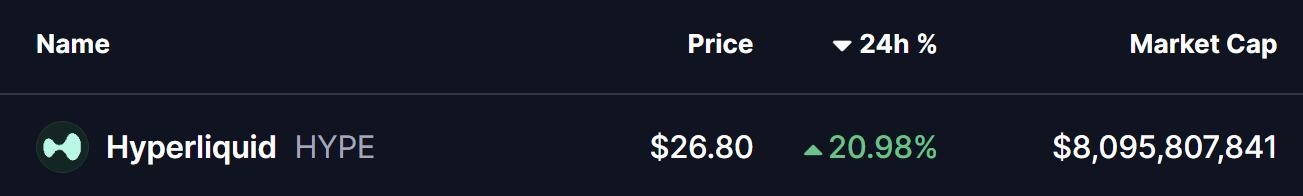
Source: Coinmarketcap
Hyperliquid’s HIP-3 Markets Hit Record Highs
According to the latest data from Flowscan, Hyperliquid’s HIP-3 protocol — launched last fall to allow builders to deploy on-chain markets for commodities like gold and silver — is seeing explosive growth.
Daily trading volume across HIP-3 markets has surged to around $1.47 billion, marking a new all-time high. At the same time, open interest (OI) has climbed to a record $793 million, largely driven by a recent spike in commodities trading activity.
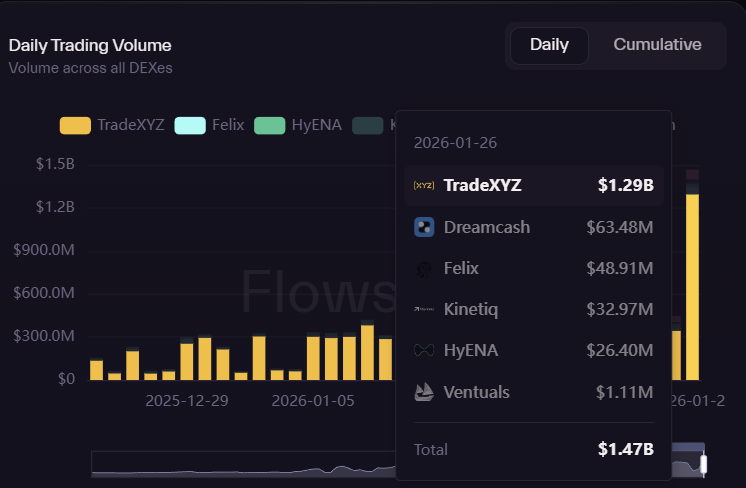
Source: flowscan
What stands out even more is the pace of growth. Just one month ago, HIP-3 open interest was sitting near $260 million. Since then, OI has been printing new weekly all-time highs, signaling rapidly increasing trader participation and capital inflows into the Hyperliquid ecosystem.
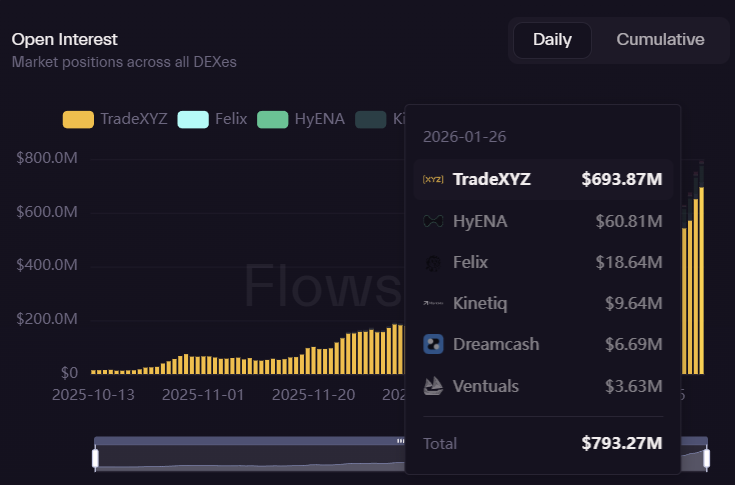
Source: flowscan
This sharp rise in volume and open interest highlights growing confidence in Hyperliquid’s on-chain derivatives infrastructure — a trend that often acts as a tailwind for the native token.
$HYPE To Rise Further?
From a technical perspective, HYPE’s daily chart is forming a Bearish Shark harmonic pattern — a structure that can appear during corrective phases but often allows for short-term bullish continuation before a larger reversal takes place.
After completing the O-X-A-B leg, HYPE managed to reclaim its 50-day moving average, an important shift in short-term momentum. The token is currently consolidating near the $23–$26 range, while facing its next major hurdle at the 100-day moving average around $31.67.
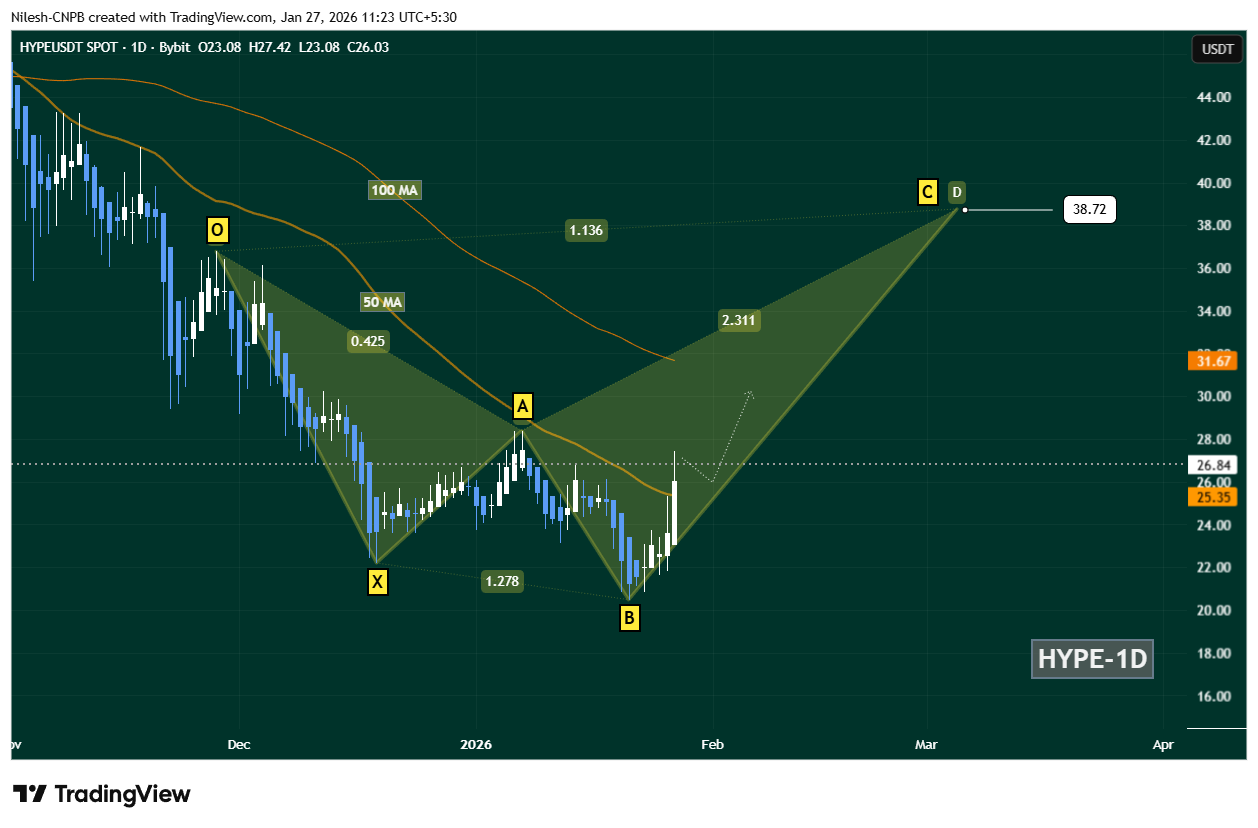
Hyperliquid (HYPE) Daily Chart/Coinsprobe (Source: Tradingview)
The key level to watch now is the 50-day MA support near $25.35. As long as HYPE holds above this zone, the bullish continuation scenario remains intact. A successful reclaim of the 100-day MA would significantly strengthen upside momentum.
If that breakout materializes, HYPE could advance toward the C-point of the Shark pattern near $38.72, which aligns with the 1.13 Fibonacci extension — a level often targeted during harmonic pattern completions.
Bottom Line
Hyperliquid’s fundamentals and technical structure are starting to align. Record-high HIP-3 trading volume, surging open interest, and renewed strength on the daily chart suggest that HYPE’s recent rally may not be a one-off move.
While resistance remains overhead near the 100-day moving average, continued support above the 50-day MA keeps the door open for further upside. If momentum holds and ecosystem growth continues at its current pace, HYPE could be positioning for another leg higher — with the $38 region emerging as a key level to watch in the weeks ahead.
Disclaimer: The views and analysis presented in this article are for informational purposes only and reflect the author’s perspective, not financial advice. Technical patterns and indicators discussed are subject to market volatility and may or may not yield the anticipated results. Investors are advised to exercise caution, conduct independent research, and make decisions aligned with their individual risk tolerance.
About Author: Nilesh Hembade is the Founder and Lead Author of Coinsprobe, with over 5 years of experience in the cryptocurrency and blockchain industry. Since launching Coinsprobe in 2023, he has been providing daily, research-driven insights through in-depth market analysis, on-chain data, and technical research.
Disclaimer: The information on this page may come from third parties and does not represent the views or opinions of Gate. The content displayed on this page is for reference only and does not constitute any financial, investment, or legal advice. Gate does not guarantee the accuracy or completeness of the information and shall not be liable for any losses arising from the use of this information. Virtual asset investments carry high risks and are subject to significant price volatility. You may lose all of your invested principal. Please fully understand the relevant risks and make prudent decisions based on your own financial situation and risk tolerance. For details, please refer to
Disclaimer.
Related Articles
TRX hits the mark of 0.32 USD: Cash flow weakens, short-term breakout scenario faces challenges.
TRON (TRX) has shown a 0.85% increase recently but struggled to maintain gains, currently hovering around $0.319. While it displays a recovery trend, weak buying momentum raises concerns about sustainability. Trading volume remains average, affecting bullish potential.
TapChiBitcoin4m ago
Analyst: TD Sequential Flashes Buy Signals for These 2 Popular Altcoins
Two of the largest and most popular altcoins might be prone to big upward moves ahead, at least according to Ali Martinez, who outlined the TD Sequential as the indicator suggesting these breakouts.
Namely, those are DOGE, which continues to struggle well below $0.10, and ADA, which has fallen
CryptoPotato55m ago
River (RIVER) Soars 50% Weekly: Further Gains Ahead or Brutal Collapse?
The lesser-known altcoin RIVER has defied the ongoing bear market, with its price spiking by double digits over the past seven days.
Some analysts expect the rally to continue, while others view the project as a red flag and warn investors to stay away.
How Much More?
--------------
RIVER is
CryptoPotato1h ago
Analysis: Bitcoin is located at the lower edge of the new buyer cost base range, and upward momentum has not yet clearly formed.
BlockBeats message, March 29, Glassnode posted that Bitcoin is currently at the lower bound of the new-buyer cost basis range (from $60,000 to $70,000). Supply accumulation is more noticeable within this price range, but compared with historical precedents that drove a strong recovery, the density of the current coin clusters is relatively thin. In terms of structure, the current accumulation pattern has constructive significance, but in terms of strength it is still insufficient and has not yet formed a clear upside momentum signal.
BlockBeatNews1h ago
Michael Saylor seems to be signaling a bullish outlook, while Goldman Sachs claims that BTC may have bottomed out.
March 29th Cryptocurrency Market News: MicroStrategy's founder gives a bullish signal, analysts focus on Saudi production cuts, High points out that Bitcoin may have already bottomed. U.S. stocks may be approaching a short-term bottom, Canada plans to ban cryptocurrency political donations. The market needs to reset in order to start a new bull market.
GateNews2h ago
XRP Ledger reaches 120 TPS, activity surges but the price remains "stagnant."
The XRP ledger is experiencing unusual activity, processing 600-700 transactions per block and over 120 transactions per second without increasing fees. This surge is mainly due to decentralized exchange (DEX) activities, particularly mass order cancellations. Despite the increase in on-chain activity, XRP's price has not reacted, indicating a disconnect between network activity and market response.
TapChiBitcoin2h ago
