
Key Takeaways
-
Ondo (ONDO) has recorded an all-time high TVL of $2.52 billion, rising over 31% in the past 30 days, signaling strong on-chain growth.
-
Active addresses, holders, and stablecoin market cap have all surged sharply, despite ONDO’s recent price correction.
-
The daily chart shows a right-angled descending broadening wedge, a structure that often appears near potential trend reversals.
The real-world asset (RWA) token Ondo (ONDO) has faced notable pressure in recent weeks, sliding nearly 13% over the past month amid the broader crypto market correction. However, while price action has remained under stress, on-chain data and chart structure tell a very different story — one that hints at growing accumulation and a potential bullish rebound forming beneath the surface.
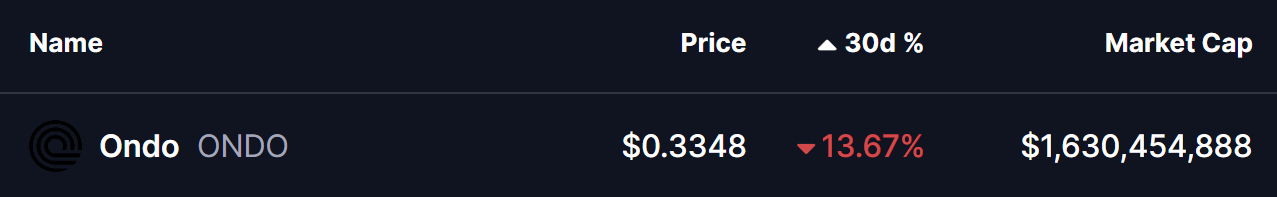
Source: Coinmarketcap
On-Chain Activity Surges Despite Price Weakness
According to the latest data from RWA.xyz, Ondo’s fundamentals continue to strengthen at an impressive pace. The protocol has now recorded an all-time high total value locked (TVL) of $2.52 billion, marking a 31.15% increase in just the past 30 days — a strong signal of rising institutional and on-chain demand.
Other key on-chain metrics are also trending higher:
-
Stablecoin market cap: $74.28 million, up 118% month-over-month
-
Total holders: 67,745, up 34.8% in 30 days
-
Monthly active addresses: 83,519, surging more than 210%
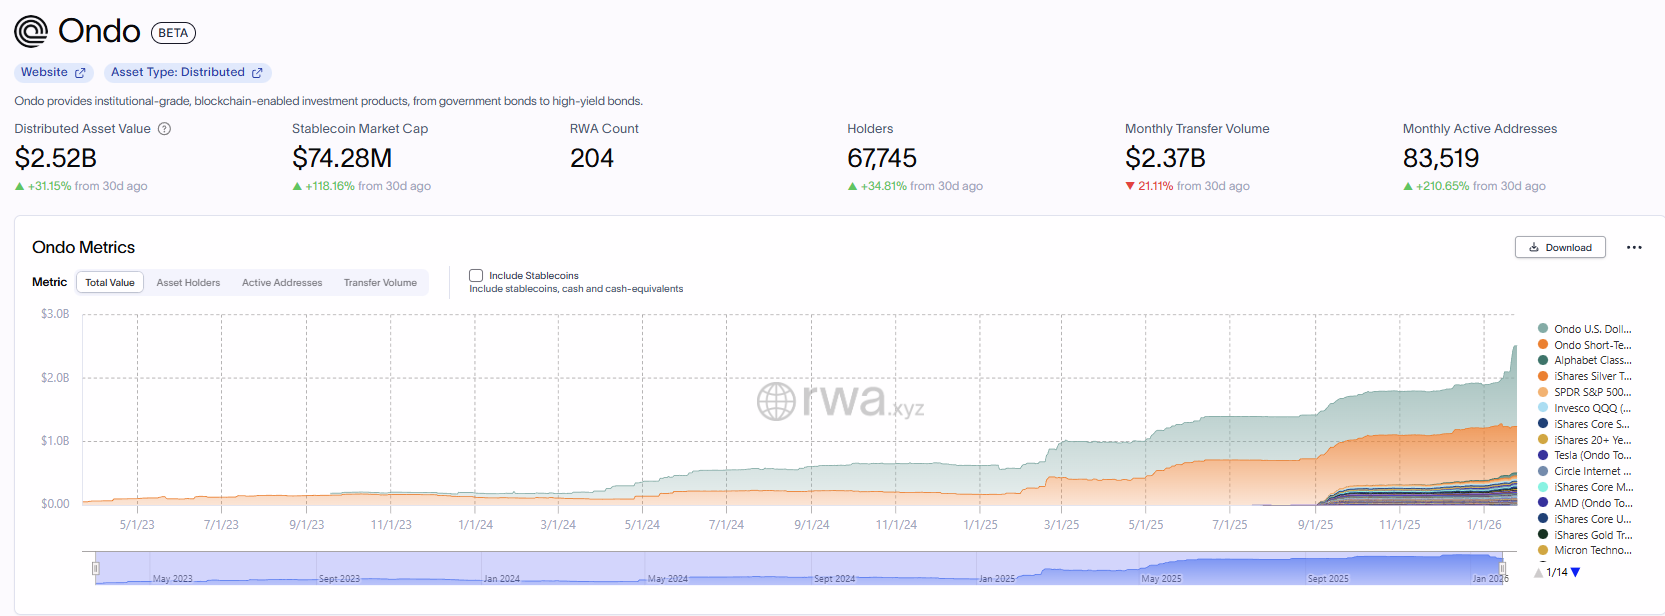
Source: rwa.xyz
This sharp rise in participation and capital flow suggests that users and institutions are increasingly engaging with Ondo’s RWA ecosystem, even as the token’s price consolidates near cycle lows.
Is a Bullish Rebound Taking Shape?
From a technical perspective, ONDO’s daily chart is carving out a right-angled descending broadening wedge — a structure commonly seen during prolonged corrections that can precede trend reversals once selling pressure begins to fade.
This pattern has been developing since ONDO’s rejection from the $1.00–$1.17 resistance zone in September 2025. Since then, price has continued to form lower highs, while volatility has expanded, driving ONDO toward the lower boundary of the wedge near $0.32.
Encouragingly, that support zone has now been successfully defended. Buyers have stepped in near the lower trendline, with ONDO currently hovering around $0.335, suggesting that downside momentum may be weakening after weeks of sustained selling.
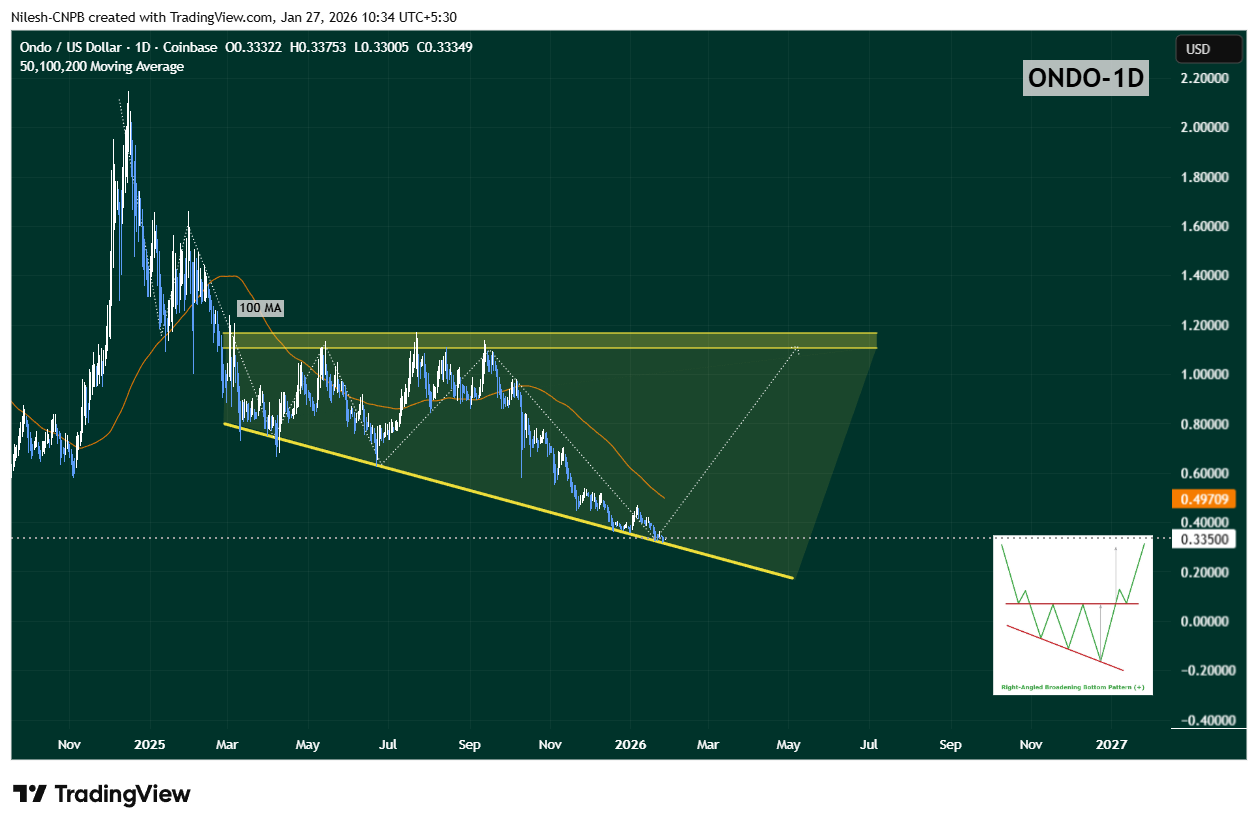
Ondo (ONDO) Daily Chart/Coinsprobe (Source: Tradingview)
Despite early stabilization, upside momentum remains capped for now. The 100-day moving average, sitting near $0.4970, has flipped into strong overhead resistance. Every prior relief rally has stalled below this level, making it a key hurdle for bulls.
Until ONDO can reclaim this moving average, any upside move should be treated as a relief bounce within consolidation, rather than a confirmed trend reversal.
What’s Next for ONDO?
As long as ONDO continues to hold above the $0.32 support zone, the right-angled descending broadening wedge remains valid. Sustained defense of this level keeps the door open for a recovery attempt, especially if price begins posting higher daily or weekly closes.
A reclaim of the 50-day moving average, followed by a breakout above the 100-day MA, would mark a clear shift in momentum. If that scenario plays out, ONDO could gradually advance toward the upper boundary of the wedge, currently aligning near the $1.10–$1.17 region — a move that would represent a major recovery from current levels.
However, a decisive breakdown below the wedge support would invalidate the bullish setup and likely lead to another phase of downside or extended consolidation.
Bottom Line
While ONDO’s price remains under pressure, the disconnect between price action and on-chain growth is becoming increasingly difficult to ignore. Record-high TVL, surging active addresses, and expanding holder counts suggest strong accumulation is taking place beneath the surface.
Combined with a technically constructive wedge pattern near long-term support, ONDO may be approaching a pivotal inflection point — one where fundamentals and structure align for a potential bullish rebound, provided key support levels continue to hold.
Disclaimer: The views and analysis presented in this article are for informational purposes only and reflect the author’s perspective, not financial advice. Technical patterns and indicators discussed are subject to market volatility and may or may not yield the anticipated results. Investors are advised to exercise caution, conduct independent research, and make decisions aligned with their individual risk tolerance.
About Author: Nilesh Hembade is the Founder and Lead Author of Coinsprobe, with over 5 years of experience in the cryptocurrency and blockchain industry. Since launching Coinsprobe in 2023, he has been providing daily, research-driven insights through in-depth market analysis, on-chain data, and technical research.
Disclaimer: The information on this page may come from third parties and does not represent the views or opinions of Gate. The content displayed on this page is for reference only and does not constitute any financial, investment, or legal advice. Gate does not guarantee the accuracy or completeness of the information and shall not be liable for any losses arising from the use of this information. Virtual asset investments carry high risks and are subject to significant price volatility. You may lose all of your invested principal. Please fully understand the relevant risks and make prudent decisions based on your own financial situation and risk tolerance. For details, please refer to
Disclaimer.
Related Articles
BTC Whale Inflows Drop, LTHs Accumulate Strongly
Recent data shows Bitcoin whale inflows to exchanges have dropped to below $3 billion, indicating reduced selling pressure. Meanwhile, long-term holders have accumulated $49 billion in Bitcoin, signaling a market transition. This shift suggests potential stability and reduced volatility, although macro factors could still affect prices.
Coinfomania15m ago
U.S.-Iran talks break down, BTC spikes then pulls back—how do geopolitical conflict and macro data affect the crypto market?
The breakdown of the nuclear talks between Iran and the U.S. caused Bitcoin to surge and then pull back, with the situation in the Strait of Hormuz and macroeconomic data becoming the focus. This article will explain the logic behind volatility in the crypto market amid geopolitical conflict and the movement of on-chain capital.
InstantTrends1h ago
The Crypto Fear and Greed Index rose to 16, and market panic sentiment eased slightly
Gate News update: On April 12, according to Alternative Data, today’s Crypto Fear and Greed Index is 16 (15 yesterday), and market panic sentiment has eased slightly. The index runs on a threshold of 0-100 and is calculated from six indicators: volatility (25%), market trading volume (25%), social media buzz (15%), market survey (15%), Bitcoin’s share of the entire market (10%), and Google keyword trend analysis (10%).
GateNews5h ago
Market Overreactions? MicroStrategy Founder: Bitcoin Has Hit Bottom, Quantum Threats Are Overblown Concerns
Michael Saylor asserted that Bitcoin has already completed a bottoming process when it reached $60k, and he believes concerns about threats from quantum computers are overstated. He predicts that in the future, Bitcoin will become the core of a digital credit system, and he noted that the market’s selling pressure is limited, which could help drive a new bull market. Mizuho also gave a positive assessment of the company’s future performance.
CryptoCity6h ago
BTC 15-minute drop of 0.45%: Aggressive sell-side orders lead, layered with weakening liquidity at the margin, amplifying volatility
2026-04-11 23:00 to 2026-04-11 23:15(UTC), BTC’s return over 15 minutes was -0.45%, and the price fluctuated within the range of 72907.4 to 73370.7 USDT, with a swing amplitude of 0.63%. During this period, market activity remains at a high level, but the price anomaly has drawn investors’ short-term attention. Overall trading sentiment is slightly cautious, and volatility is marginally higher than usual.
The main driver behind this anomaly is that active sell orders have a slight advantage, causing a short-term downward adjustment in price. Combined with a modest increase in trading volume for major trading pairs and spot
GateNews7h ago
Market in Excessive Panic? MicroStrategy Founder: Bitcoin Has Bottomed, Quantum Threats Are Overblown Worry
Michael Saylor asserts that Bitcoin has finished bottoming out when it hit $60k, and he believes concerns about threats from quantum computers are overblown. He predicts that in the future, Bitcoin will become the core of a digital credit system, and he notes that there is limited selling pressure in the market, which could help drive a new bull run. Mizuho also has a positive assessment of the company’s future performance.
CryptoCity9h ago
