
Kaspa has been taking some heat lately, and the daily chart is starting to show the effects. As pointed out by KaspaDaily, the KAS price has now slipped into oversold territory on the daily RSI. That’s usually a sign that selling pressure is getting stretched and that the market may need a pause.
At the moment, the KAS price is hovering around $0.035, after days of steady downside. This hasn’t been a sudden crash, but a slow grind lower that’s worn buyers down and pushed momentum indicators to their limits.
- Kaspa Has Been Under Steady Selling Pressure
- All Eyes on Nearby Support
- The Next Few Days Matter for KAS
Kaspa Has Been Under Steady Selling Pressure
Looking at the daily chart shared by KaspaDaily, the direction of the KAS price has been pretty clear. After topping out in the $0.055 to $0.060 range, price started printing lower highs and lower lows. Each bounce attempt faded sooner than the last, keeping pressure on the downside.
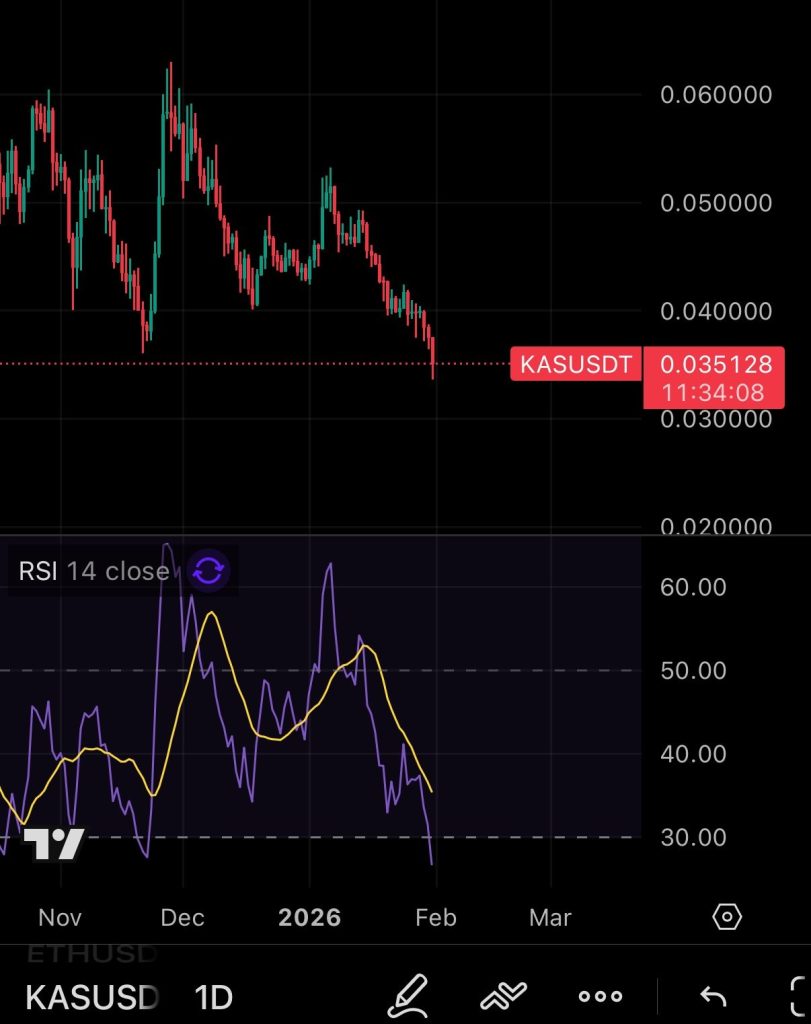
Source: X/@DailyKaspa
The $0.040 area tried to hold earlier in the move, but once that level broke, the KAS price slipped further without much resistance. By the time price reached the mid-$0.03 range, momentum had already weakened significantly, setting the stage for the current oversold reading.
The daily RSI dropping near the 30 level doesn’t mean Kaspa suddenly flips bullish. What it does mean is that selling has become crowded. A lot of traders who wanted out have likely already sold, and pushing the price much lower often takes more effort at this stage.
For the KAS price, oversold conditions usually lead to a slowdown. Sometimes that shows up as sideways movement. Other times there’s a short relief bounce. Either way, trends often lose speed when momentum gets this stretched.
All Eyes on Nearby Support
Right now, the zone between roughly $0.035 and $0.032 is the area to watch. This is where the KAS price is trying to find its footing. It’s close to prior reaction levels and sits just above the next visible support on the chart.
If price holds this range, Kaspa may spend some time stabilizing and letting indicators cool off. If sellers keep pressing and price slips cleanly below $0.032, attention shifts to lower levels that haven’t been tested recently.
Kaspa (KAS) vs BNB: This Comparison Makes BNB Look Uncomfortable_**
The Next Few Days Matter for KAS
The key takeaway here isn’t that the KAS price has to bounce right away. It’s that the pace of the decline is changing. Oversold conditions often force the market to slow down and reassess.
How Kaspa behaves over the next few daily candles will be important. If the sellers step back and the price starts to base, then we have a different story from another big move down. For now, the price of KAS is at a crossroads, and the market is waiting to see who blinks first.
Disclaimer: The information on this page may come from third parties and does not represent the views or opinions of Gate. The content displayed on this page is for reference only and does not constitute any financial, investment, or legal advice. Gate does not guarantee the accuracy or completeness of the information and shall not be liable for any losses arising from the use of this information. Virtual asset investments carry high risks and are subject to significant price volatility. You may lose all of your invested principal. Please fully understand the relevant risks and make prudent decisions based on your own financial situation and risk tolerance. For details, please refer to
Disclaimer.
Related Articles
BTC Whale Inflows Drop, LTHs Accumulate Strongly
Recent data shows Bitcoin whale inflows to exchanges have dropped to below $3 billion, indicating reduced selling pressure. Meanwhile, long-term holders have accumulated $49 billion in Bitcoin, signaling a market transition. This shift suggests potential stability and reduced volatility, although macro factors could still affect prices.
Coinfomania15m ago
U.S.-Iran talks break down, BTC spikes then pulls back—how do geopolitical conflict and macro data affect the crypto market?
The breakdown of the nuclear talks between Iran and the U.S. caused Bitcoin to surge and then pull back, with the situation in the Strait of Hormuz and macroeconomic data becoming the focus. This article will explain the logic behind volatility in the crypto market amid geopolitical conflict and the movement of on-chain capital.
InstantTrends1h ago
The Crypto Fear and Greed Index rose to 16, and market panic sentiment eased slightly
Gate News update: On April 12, according to Alternative Data, today’s Crypto Fear and Greed Index is 16 (15 yesterday), and market panic sentiment has eased slightly. The index runs on a threshold of 0-100 and is calculated from six indicators: volatility (25%), market trading volume (25%), social media buzz (15%), market survey (15%), Bitcoin’s share of the entire market (10%), and Google keyword trend analysis (10%).
GateNews5h ago
Market Overreactions? MicroStrategy Founder: Bitcoin Has Hit Bottom, Quantum Threats Are Overblown Concerns
Michael Saylor asserted that Bitcoin has already completed a bottoming process when it reached $60k, and he believes concerns about threats from quantum computers are overstated. He predicts that in the future, Bitcoin will become the core of a digital credit system, and he noted that the market’s selling pressure is limited, which could help drive a new bull market. Mizuho also gave a positive assessment of the company’s future performance.
CryptoCity6h ago
BTC 15-minute drop of 0.45%: Aggressive sell-side orders lead, layered with weakening liquidity at the margin, amplifying volatility
2026-04-11 23:00 to 2026-04-11 23:15(UTC), BTC’s return over 15 minutes was -0.45%, and the price fluctuated within the range of 72907.4 to 73370.7 USDT, with a swing amplitude of 0.63%. During this period, market activity remains at a high level, but the price anomaly has drawn investors’ short-term attention. Overall trading sentiment is slightly cautious, and volatility is marginally higher than usual.
The main driver behind this anomaly is that active sell orders have a slight advantage, causing a short-term downward adjustment in price. Combined with a modest increase in trading volume for major trading pairs and spot
GateNews7h ago
Market in Excessive Panic? MicroStrategy Founder: Bitcoin Has Bottomed, Quantum Threats Are Overblown Worry
Michael Saylor asserts that Bitcoin has finished bottoming out when it hit $60k, and he believes concerns about threats from quantum computers are overblown. He predicts that in the future, Bitcoin will become the core of a digital credit system, and he notes that there is limited selling pressure in the market, which could help drive a new bull run. Mizuho also has a positive assessment of the company’s future performance.
CryptoCity9h ago
