
The SUI price is back in focus, and this time it’s not because of a quick spike or social hype. A weekly chart shared by Crypto Patel is getting a lot of attention because it shows something more structural, not something driven by short-term excitement.
This is the kind of setup that tends to form quietly, long before price starts making headlines. It’s not about what SUI does tomorrow or whether it moves a few cents from $1.22 to $1.30. It’s about where the SUI price is sitting right now in the bigger picture.
- The Larger Trend Structure for SUI Remains Intact
- A Classic SUI Liquidity Flush Into Demand
- Compression Below a Key Ceiling
- What’s Next for SUI?
The Larger Trend Structure for SUI Remains Intact
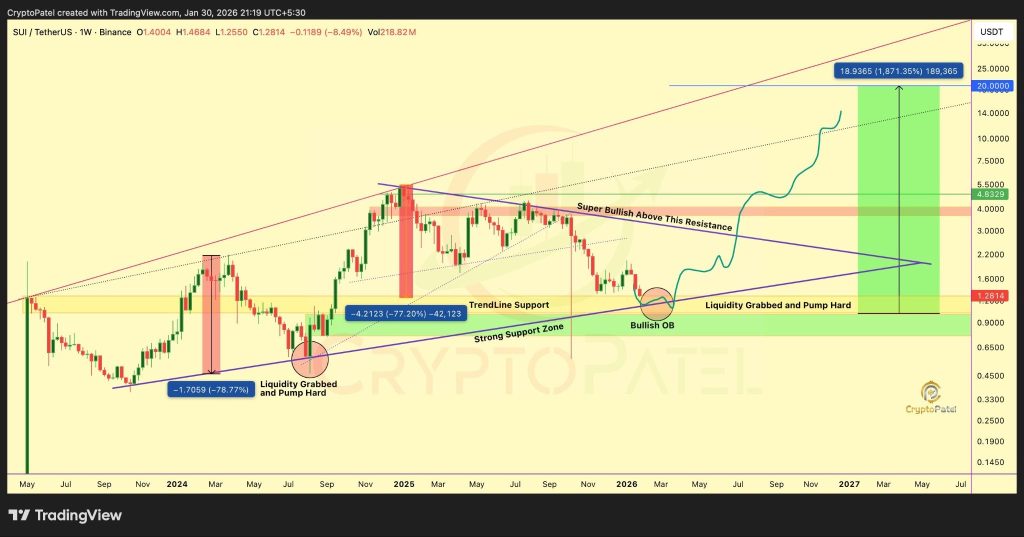
On the weekly chart shared by Patel, the SUI price is still moving inside a clear ascending channel that has been respected for an extended period.
Every major pullback has found support near the lower boundary of that channel, followed by strong rebounds that pushed the price higher again, often by multiples from those lows.
Source: X/@CryptoPatel
The latest drop fits that pattern almost perfectly. The SUI price rolled over from its prior highs near the $4.80–$5.00 area and slid straight back into trendline support.
That support zone overlaps with the $1.10 to $1.30 area which has acted as a decision point before. Once again, the price did not collapse through it. As long as the SUI price stays inside this channel, the broader structure remains intact.
A Classic SUI Liquidity Flush Into Demand
One detail that stands out is how the recent downside move unfolded. The SUI price dipped below prior weekly lows, briefly trading under $1.20 and sweeping sell-side liquidity.
Stops were triggered, weak positions were forced out, and price was pushed directly into a clearly defined weekly demand area between roughly $1.15 and $0.80. That zone matters. It’s where buyers previously stepped in aggressively, and the reaction this time shows that demand hasn’t disappeared.
After tagging that zone, downside pressure slowed and the SUI price began stabilizing back above $1.20. This is often the phase where stronger hands start positioning, even though price action still looks uneven and unconvincing on the surface.
Compression Below a Key Ceiling
Above current levels, the SUI price is capped by a higher-timeframe resistance zone that has rejected price multiple times, most notably near the $4.00 to $4.80 range. With rising support underneath and resistance overhead, price is compressing into a tighter range between roughly $1.20 and that upper boundary.
Compression like this doesn’t last forever. When it resolves, it often does so quickly. If the SUI price breaks and holds above that resistance zone, the weekly structure turns decisively bullish. Until then, the market remains in waiting mode, and chasing early moves tends to come with risk.
Zcash (ZEC) Price Prediction: More Downside Coming_**
What’s Next for SUI?
The projected targets of $5, $10, and $20 are tied to a confirmed breakout, not the current range near $1.22. Those levels line up with extensions inside the broader channel and prior expansion zones. Reaching them would require clear acceptance above resistance and sustained follow-through.
For now, the SUI price is sitting at a crossroads. Demand is active, structure hasn’t failed, and compression is tightening. This is often how larger moves begin, slowly, quietly, and without much excitement. The real question isn’t whether SUI moves eventually. It’s whether traders are patient enough to wait for the SUI price to prove it.
Disclaimer: The information on this page may come from third parties and does not represent the views or opinions of Gate. The content displayed on this page is for reference only and does not constitute any financial, investment, or legal advice. Gate does not guarantee the accuracy or completeness of the information and shall not be liable for any losses arising from the use of this information. Virtual asset investments carry high risks and are subject to significant price volatility. You may lose all of your invested principal. Please fully understand the relevant risks and make prudent decisions based on your own financial situation and risk tolerance. For details, please refer to
Disclaimer.
Related Articles
BTC Whale Inflows Drop, LTHs Accumulate Strongly
Recent data shows Bitcoin whale inflows to exchanges have dropped to below $3 billion, indicating reduced selling pressure. Meanwhile, long-term holders have accumulated $49 billion in Bitcoin, signaling a market transition. This shift suggests potential stability and reduced volatility, although macro factors could still affect prices.
Coinfomania15m ago
U.S.-Iran talks break down, BTC spikes then pulls back—how do geopolitical conflict and macro data affect the crypto market?
The breakdown of the nuclear talks between Iran and the U.S. caused Bitcoin to surge and then pull back, with the situation in the Strait of Hormuz and macroeconomic data becoming the focus. This article will explain the logic behind volatility in the crypto market amid geopolitical conflict and the movement of on-chain capital.
InstantTrends1h ago
The Crypto Fear and Greed Index rose to 16, and market panic sentiment eased slightly
Gate News update: On April 12, according to Alternative Data, today’s Crypto Fear and Greed Index is 16 (15 yesterday), and market panic sentiment has eased slightly. The index runs on a threshold of 0-100 and is calculated from six indicators: volatility (25%), market trading volume (25%), social media buzz (15%), market survey (15%), Bitcoin’s share of the entire market (10%), and Google keyword trend analysis (10%).
GateNews5h ago
Market Overreactions? MicroStrategy Founder: Bitcoin Has Hit Bottom, Quantum Threats Are Overblown Concerns
Michael Saylor asserted that Bitcoin has already completed a bottoming process when it reached $60k, and he believes concerns about threats from quantum computers are overstated. He predicts that in the future, Bitcoin will become the core of a digital credit system, and he noted that the market’s selling pressure is limited, which could help drive a new bull market. Mizuho also gave a positive assessment of the company’s future performance.
CryptoCity6h ago
BTC 15-minute drop of 0.45%: Aggressive sell-side orders lead, layered with weakening liquidity at the margin, amplifying volatility
2026-04-11 23:00 to 2026-04-11 23:15(UTC), BTC’s return over 15 minutes was -0.45%, and the price fluctuated within the range of 72907.4 to 73370.7 USDT, with a swing amplitude of 0.63%. During this period, market activity remains at a high level, but the price anomaly has drawn investors’ short-term attention. Overall trading sentiment is slightly cautious, and volatility is marginally higher than usual.
The main driver behind this anomaly is that active sell orders have a slight advantage, causing a short-term downward adjustment in price. Combined with a modest increase in trading volume for major trading pairs and spot
GateNews7h ago
Market in Excessive Panic? MicroStrategy Founder: Bitcoin Has Bottomed, Quantum Threats Are Overblown Worry
Michael Saylor asserts that Bitcoin has finished bottoming out when it hit $60k, and he believes concerns about threats from quantum computers are overblown. He predicts that in the future, Bitcoin will become the core of a digital credit system, and he notes that there is limited selling pressure in the market, which could help drive a new bull run. Mizuho also has a positive assessment of the company’s future performance.
CryptoCity9h ago
