
Key Takeaways
-
NEAR is forming a potential double bottom pattern near the $1.40 support zone.
-
Holding above $1.40 keeps the bullish reversal scenario intact.
-
A breakout above $1.87 could confirm the pattern and trigger a stronger recovery.
The broader cryptocurrency market has once again slipped into a corrective phase after a strong start to the year. Bitcoin (BTC), which recently surged above the $95,000 mark, has pulled back sharply and is now trading below $88,000. Ethereum (ETH) has faced even heavier pressure, sliding nearly 10% over the past week — a move that has weighed on major altcoins across the board.
Near Protocol (NEAR) hasn’t been spared either. The token is currently down around 6% on the week. However, beneath the surface, NEAR’s price action is beginning to show a familiar and potentially bullish setup — one that could hint at a bounce back if key levels hold.
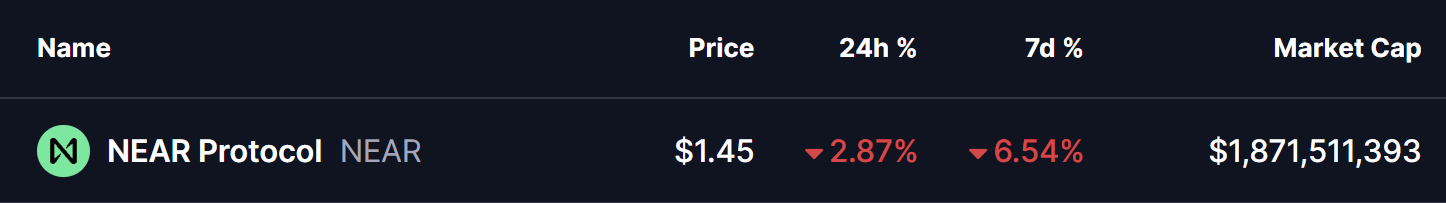
Source: Coinmarketcap
Double Bottom Pattern in Play?
On the daily timeframe, NEAR appears to be forming a potential double bottom pattern, a well-known bullish reversal structure that often emerges near the end of extended downtrends.
The first bottom formed when NEAR dropped toward the $1.40 region, followed by a recovery attempt that pushed price back toward the neckline resistance around $1.87. That move, however, faced rejection, sending NEAR back down to retest the same $1.40 support zone.
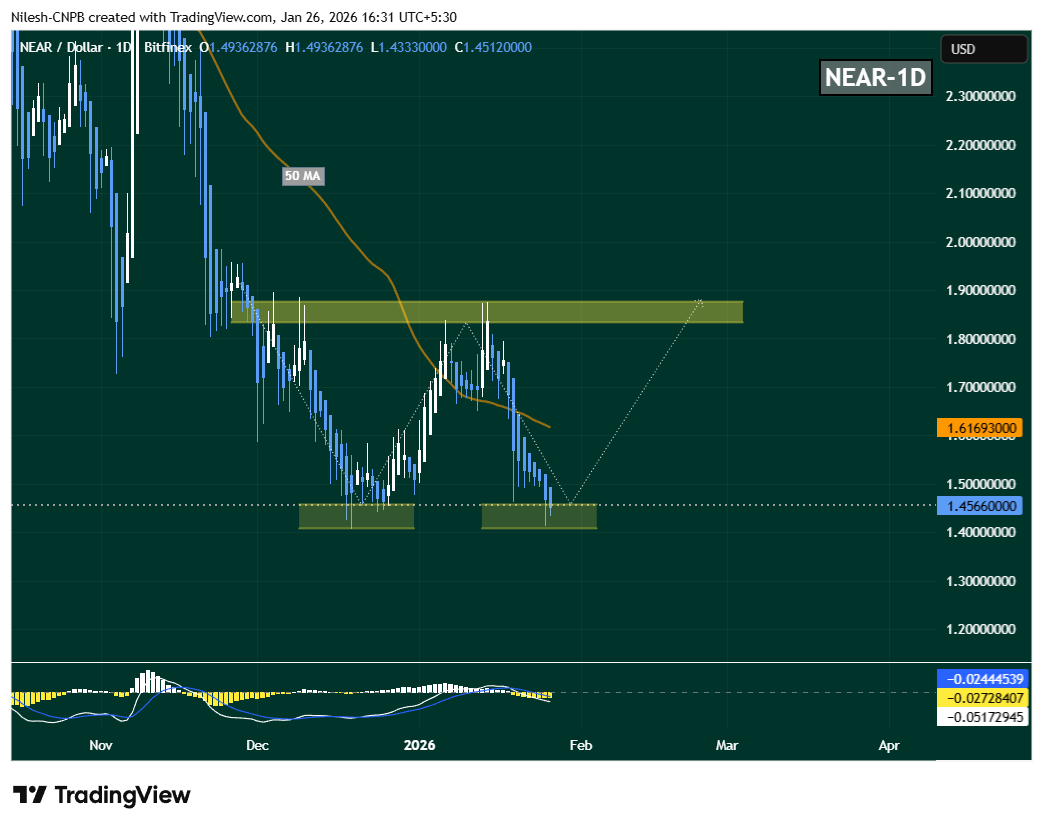
Near Protocol (NEAR) Daily Chart/Coinsprobe (Source: Tradingview)
What stands out is that buyers stepped in once again at this level. NEAR has so far held above this support and is currently trading near $1.45, signaling that selling pressure may be weakening. Adding to this setup, the MACD indicator is beginning to hint at a possible bullish crossover — often an early signal that momentum could start shifting in favor of the bulls.
What’s Next for NEAR?
For this bullish structure to gain traction, NEAR needs to reclaim the 50-day moving average, which sits near $1.6169. A sustained move above this level would mark an important shift in short-term momentum and increase the odds of a continued recovery toward the neckline resistance at $1.87.
A decisive breakout above that neckline — ideally followed by a successful retest — would confirm the double bottom pattern and potentially open the door for a stronger upside move.
On the downside, the $1.40 support zone remains the most critical level to watch. A failure to hold this area would invalidate the bullish setup and expose NEAR to deeper downside risk.
Overall, NEAR’s structure appears constructive. The repeated defense of identical lows, the developing double bottom, and price hovering near the 50-day moving average suggest that the token could be approaching a pivotal moment — one where accumulation transitions into a potential recovery phase if broader market conditions stabilize.
Disclaimer: The views and analysis presented in this article are for informational purposes only and reflect the author’s perspective, not financial advice. Technical patterns and indicators discussed are subject to market volatility and may or may not yield the anticipated results. Investors are advised to exercise caution, conduct independent research, and make decisions aligned with their individual risk tolerance.
About Author: Nilesh Hembade is the Founder and Lead Author of Coinsprobe, with over 5 years of experience in the cryptocurrency and blockchain industry. Since launching Coinsprobe in 2023, he has been providing daily, research-driven insights through in-depth market analysis, on-chain data, and technical research.
Disclaimer: The information on this page may come from third parties and does not represent the views or opinions of Gate. The content displayed on this page is for reference only and does not constitute any financial, investment, or legal advice. Gate does not guarantee the accuracy or completeness of the information and shall not be liable for any losses arising from the use of this information. Virtual asset investments carry high risks and are subject to significant price volatility. You may lose all of your invested principal. Please fully understand the relevant risks and make prudent decisions based on your own financial situation and risk tolerance. For details, please refer to
Disclaimer.
Related Articles
XRP Payments Fall 77% as Price Eyes End to Rally - U.Today
XRP's on-chain payment volume has dropped 77% to 86 million, signaling bearish momentum as its price stagnates below $1.35. This decline has raised investor concerns about potential volatility in the crypto market.
UToday23m ago
Shiba Inu Supply Locked Away as Ryoshi's Earlier Move Seals SHIB's Fate - U.Today
Shibizens highlights Shiba Inu's tokenomics, detailing how founder Ryoshi locked 50% of the supply in Uniswap for liquidity. This approach, including a significant burn by Vitalik Buterin, aimed for a fair launch, impacting SHIB's market price amid recent inflation data.
UToday39m ago
BTC Whale Inflows Drop, LTHs Accumulate Strongly
Recent data shows Bitcoin whale inflows to exchanges have dropped to below $3 billion, indicating reduced selling pressure. Meanwhile, long-term holders have accumulated $49 billion in Bitcoin, signaling a market transition. This shift suggests potential stability and reduced volatility, although macro factors could still affect prices.
Coinfomania1h ago
U.S.-Iran talks break down, BTC spikes then pulls back—how do geopolitical conflict and macro data affect the crypto market?
The breakdown of the nuclear talks between Iran and the U.S. caused Bitcoin to surge and then pull back, with the situation in the Strait of Hormuz and macroeconomic data becoming the focus. This article will explain the logic behind volatility in the crypto market amid geopolitical conflict and the movement of on-chain capital.
InstantTrends2h ago
The Crypto Fear and Greed Index rose to 16, and market panic sentiment eased slightly
Gate News update: On April 12, according to Alternative Data, today’s Crypto Fear and Greed Index is 16 (15 yesterday), and market panic sentiment has eased slightly. The index runs on a threshold of 0-100 and is calculated from six indicators: volatility (25%), market trading volume (25%), social media buzz (15%), market survey (15%), Bitcoin’s share of the entire market (10%), and Google keyword trend analysis (10%).
GateNews7h ago
Market Overreactions? MicroStrategy Founder: Bitcoin Has Hit Bottom, Quantum Threats Are Overblown Concerns
Michael Saylor asserted that Bitcoin has already completed a bottoming process when it reached $60k, and he believes concerns about threats from quantum computers are overstated. He predicts that in the future, Bitcoin will become the core of a digital credit system, and he noted that the market’s selling pressure is limited, which could help drive a new bull market. Mizuho also gave a positive assessment of the company’s future performance.
CryptoCity7h ago
