
Aster price is sitting at a moment that feels uncomfortable for short-term traders and cautious observers alike. The charts show a market that tried to lift, failed to hold key levels, and now sits back at a zone that has already been tested before. Price action looks heavy again, and the latest candles offer little relief for anyone hoping the downside pressure is finished.
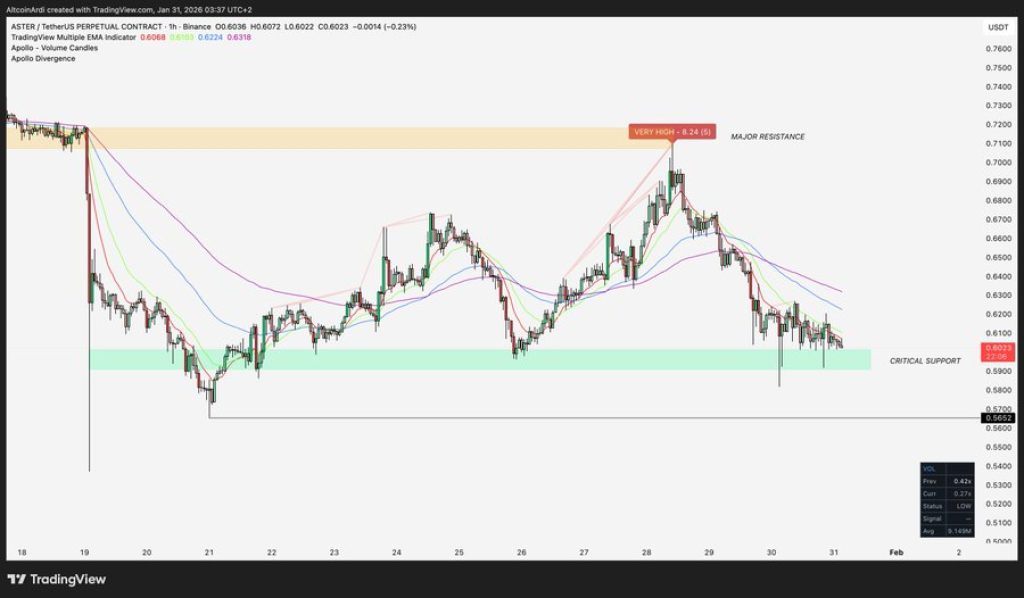
Aster price has drifted back into the $0.60 support area, a zone that already proved important earlier in the month. Analyst Ardi points out that this level acted as a temporary floor before, yet the structure now looks weaker. Price previously attempted to recover toward $0.72, which became the main resistance area and slowed further downside. That rejection mattered more than it first appeared.
Ardi explains that the push into $0.72 showed clear signs of exhaustion. The divergence indicator on the chart highlighted that momentum near the highs was stretched. Buyers were present, yet strength faded fast. That setup often leaves price vulnerable once momentum cools. The current return to $0.60 confirms that the bounce lacked durability.
@ArdiNSC / X
Ardi also notes that losing this support could open the door toward the $0.55 wick area. That level lines up with prior downside probes on the chart and represents the next visible zone where buyers may try to step in. He stresses that the broader ASTER price trend still leans lower, and the market does not look prepared for sideways movement yet. Pressure remains pointed downward, and the structure suggests more work is needed before stability appears.
Aster Price Structure Shows Weak Bounces And Limited Buyer Control
Aster price action over recent days shows a pattern of lower highs and shallow rebounds. Each attempt to lift has faced selling pressure quickly, which keeps the structure tilted in favor of sellers. Support at $0.60 matters because repeated tests weaken confidence, especially when rebounds struggle to travel far.
The broader chart shows that previous rallies failed to establish higher ground. That behavior often signals that buyers are defensive rather than aggressive. Price holding this zone may delay further losses, yet the lack of strong follow through keeps downside risks active. Aster price still trades within a declining channel, and that context shapes expectations over the short term.
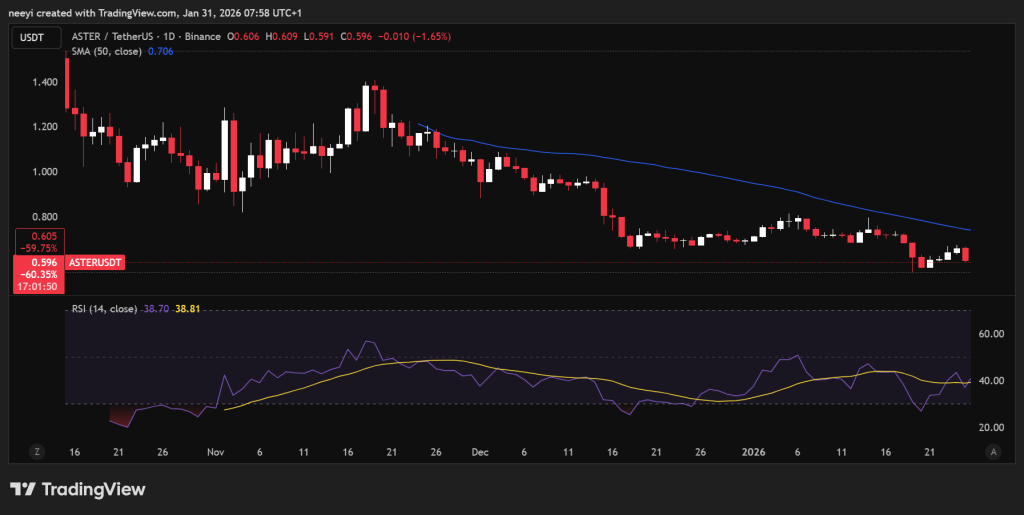
ASTER Price Trades Below 50 Day SMA As RSI Leaves Room Lower
ASTER price also remains below the 50 day simple moving average on the daily chart. That moving average slopes downward and acts as a short term trend guide. Trading below it usually signals that price has not regained control from sellers. A reversal attempt typically needs price to reclaim this level with conviction, which has not happened yet.
ASTER Price Chart
Momentum indicators echo the same message. The RSI sits near 38, which places it below the neutral zone. That reading shows weakness without reaching deeply oversold conditions. Space still exists for the indicator to move lower if selling pressure increases. The chart suggests that momentum has not fully reset, which reduces the odds of an immediate recovery.
Zcash (ZEC) Price Prediction: More Downside Coming_**
Aster price now faces a clear test. Holding $0.60 could slow the decline, yet failure may invite another push lower before any meaningful consolidation appears.
Disclaimer: The information on this page may come from third parties and does not represent the views or opinions of Gate. The content displayed on this page is for reference only and does not constitute any financial, investment, or legal advice. Gate does not guarantee the accuracy or completeness of the information and shall not be liable for any losses arising from the use of this information. Virtual asset investments carry high risks and are subject to significant price volatility. You may lose all of your invested principal. Please fully understand the relevant risks and make prudent decisions based on your own financial situation and risk tolerance. For details, please refer to
Disclaimer.
Related Articles
CTSI Price Soars 17.57%: Institutional Interest Ramps Up
Amid a crypto market downturn, CTSI surged 17.57% to $0.03626 in an hour, driven by high trading volume and institutional interest in altcoins. Traders are now watching key support and resistance levels for future price movements.
Coinfomania57m ago
Bitcoin falls below 71,500 USD, U.S.-Iran talks remain deadlocked, and the Strait of Hormuz becomes the biggest point of contention
On April 11, the U.S. and Iran began 20 hours of negotiations in Pakistan. The core issue was freedom of passage through the Strait of Hormuz. After Bitcoin briefly rose to $73,800, it quickly fell back to $71,557. The U.S. side took a hardline stance, demanding that Iran open the strait, while Iran insisted that easing restrictions must wait until a comprehensive agreement is reached. The two sides have not yet reached a consensus.
動區BlockTempo5h ago
Crypto Market Maintains Steady Growth Trajectory As Top Assets Show Gains
The crypto market continues to grow, with a market cap of $2.44T and Bitcoin and Ethereum showing slight increases. Top gainers include $GPM and $BASE. Meanwhile, DeFi TVL declined, NFT sales rose, and notable developments include a trader's significant loss and a push for regulatory clarity in Congress.
BlockChainReporter6h ago
BTC 15-minute chart slightly down 0.57%: leveraged long positions passively cut risk and macro sentiment disturbances drive volatility
2026-04-12 12:45 to 13:00 (UTC), the BTC price range was 71081.7 to 71493.2 USDT, with an amplitude of 0.58%. Within 15 minutes, the return recorded was -0.57%. During the period of unusual activity, market volatility increased somewhat, risk sentiment warmed up, and overall attention rose; however, there was no extreme surge in volume or a sudden drop in liquidity.
The main driver behind this unusual activity is that, under the leverage structure, long positions were reduced passively. Recently, the funding rate for perpetual contracts turned from negative to positive. Leverage among longs in the market accumulated; the price dipped slightly, triggering liquidations of some leveraged long positions and sell orders for position closures, resulting in
GateNews8h ago
Analyst: Bitcoin’s current pullback is relatively mild compared with past ones, but the bottom has not been confirmed yet.
Crypto analyst Axel Adler Jr said the current Bitcoin pullback is smaller than historic bearish-market levels, but a bottom has not yet been confirmed. He believes the market is still in a mild bear phase, and that a true recovery will require patience and waiting.
GateNews9h ago
Bitcoin long-term holdings increased to 12.4 million coins, and the 30-day change has remained positive.
CryptoQuant analyst Darkfost says the Bitcoin market is entering an early stabilization phase, with stronger long-term holding behavior. The amount of BTC held for more than a year has increased, and investors are more inclined to hold than to distribute. This suggests the market is transitioning toward long-term conviction; the current trend is viewed as an early stability signal, but it needs longer-term confirmation.
GateNews11h ago
