
Key Takeaways
-
Pump.fun (PUMP) has surged over 18% recently, extending its monthly gains to nearly 60%.
-
The daily chart shows a clear inverse head and shoulders pattern, a classic bullish reversal setup.
-
PUMP has reclaimed the 50-day moving average, which is now acting as key short-term support.
-
The $0.003025 neckline resistance is the critical breakout level to watch.
-
A confirmed breakout could target $0.004612, implying a potential 53% upside.
Pump.fun (PUMP), the native token of the popular Solana-based launchpad protocol, is quietly gaining traction in the crypto market. After posting a sharp 18%+ rally, PUMP has now extended its monthly gains to nearly 60%. While the price surge has caught traders’ attention, a closer look at the daily chart structure suggests this move could be part of a larger bullish setup — provided a key resistance level is cleared.
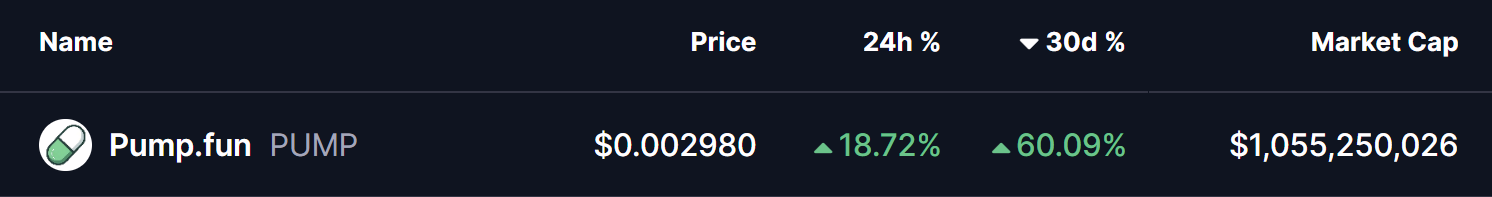
Source: Coinmarketcap
Inverse Head and Shoulders Pattern Takes Shape
On the daily timeframe, PUMP has carved out a well-defined inverse head and shoulders pattern, one of the most widely followed bullish reversal formations in technical analysis.
-
The left shoulder formed in early December near the $0.00247 region.
-
This was followed by a deeper pullback toward $0.00167, creating the head of the structure.
-
Price then recovered and found support again near $0.00225, completing the right shoulder.
Following the formation of this structure, PUMP rebounded steadily and has successfully reclaimed the 50-day moving average, which is now acting as dynamic support. The token is currently consolidating just below the neckline resistance around $0.003025, a level clearly highlighted on the chart.
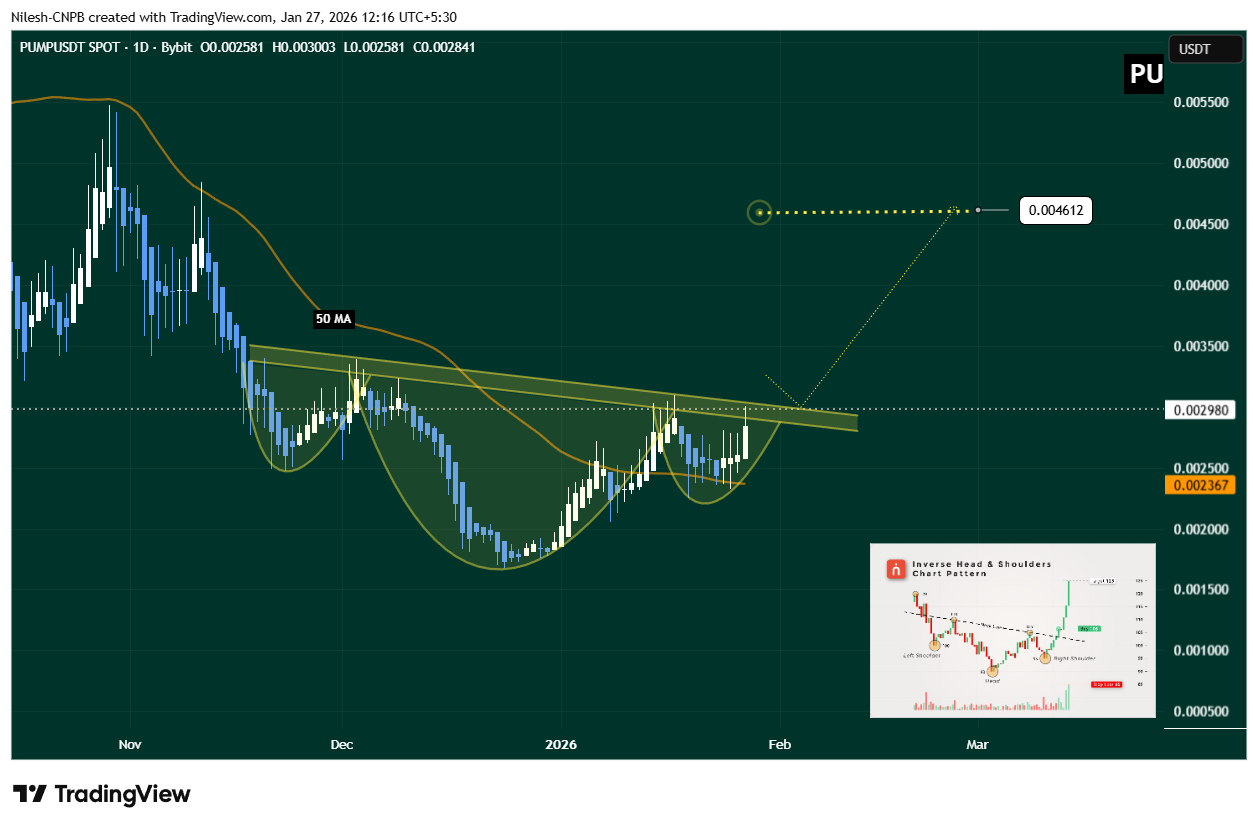
Pump.fun (PUMP) Daily Chart/Coinsprobe (Source: Tradingview)
This tightening price action near resistance often precedes a volatility expansion, suggesting a decisive move could be approaching.
What’s Next for PUMP?
For bullish momentum to gain confirmation, PUMP needs a strong daily close above the $0.003025 neckline, ideally followed by a successful retest of this zone as support. Such a move would validate the inverse head and shoulders breakout and signal a shift in short-term market structure.
Based on the measured move from the inverse head and shoulders pattern, a confirmed breakout could open the door for a price target near $0.004612 — representing a potential 53% upside from the breakout zone.
On the downside, failure to clear the neckline could lead to further consolidation. In that scenario, holding above the 50-day moving average and the $0.002367 support zone will be critical to keep the broader bullish setup intact.
Bottom Line
PUMP’s recent rally appears to be supported by a constructive chart pattern and improving momentum. As long as price continues to coil beneath neckline resistance while holding key support levels, the probability of a breakout remains elevated.
A decisive move above $0.003025 could mark the start of a fresh upside leg, while rejection would likely extend the current consolidation.
Disclaimer: The views and analysis presented in this article are for informational purposes only and reflect the author’s perspective, not financial advice. Technical patterns and indicators discussed are subject to market volatility and may or may not yield the anticipated results. Investors are advised to exercise caution, conduct independent research, and make decisions aligned with their individual risk tolerance.
About Author: Nilesh Hembade is the Founder and Lead Author of Coinsprobe, with over 5 years of experience in the cryptocurrency and blockchain industry. Since launching Coinsprobe in 2023, he has been providing daily, research-driven insights through in-depth market analysis, on-chain data, and technical research.
Disclaimer: The information on this page may come from third parties and does not represent the views or opinions of Gate. The content displayed on this page is for reference only and does not constitute any financial, investment, or legal advice. Gate does not guarantee the accuracy or completeness of the information and shall not be liable for any losses arising from the use of this information. Virtual asset investments carry high risks and are subject to significant price volatility. You may lose all of your invested principal. Please fully understand the relevant risks and make prudent decisions based on your own financial situation and risk tolerance. For details, please refer to
Disclaimer.
Related Articles
XRP Payments Fall 77% as Price Eyes End to Rally - U.Today
XRP's on-chain payment volume has dropped 77% to 86 million, signaling bearish momentum as its price stagnates below $1.35. This decline has raised investor concerns about potential volatility in the crypto market.
UToday2h ago
Shiba Inu Supply Locked Away as Ryoshi's Earlier Move Seals SHIB's Fate - U.Today
Shibizens highlights Shiba Inu's tokenomics, detailing how founder Ryoshi locked 50% of the supply in Uniswap for liquidity. This approach, including a significant burn by Vitalik Buterin, aimed for a fair launch, impacting SHIB's market price amid recent inflation data.
UToday2h ago
BTC Whale Inflows Drop, LTHs Accumulate Strongly
Recent data shows Bitcoin whale inflows to exchanges have dropped to below $3 billion, indicating reduced selling pressure. Meanwhile, long-term holders have accumulated $49 billion in Bitcoin, signaling a market transition. This shift suggests potential stability and reduced volatility, although macro factors could still affect prices.
Coinfomania3h ago
U.S.-Iran talks break down, BTC spikes then pulls back—how do geopolitical conflict and macro data affect the crypto market?
The breakdown of the nuclear talks between Iran and the U.S. caused Bitcoin to surge and then pull back, with the situation in the Strait of Hormuz and macroeconomic data becoming the focus. This article will explain the logic behind volatility in the crypto market amid geopolitical conflict and the movement of on-chain capital.
InstantTrends4h ago
The Crypto Fear and Greed Index rose to 16, and market panic sentiment eased slightly
Gate News update: On April 12, according to Alternative Data, today’s Crypto Fear and Greed Index is 16 (15 yesterday), and market panic sentiment has eased slightly. The index runs on a threshold of 0-100 and is calculated from six indicators: volatility (25%), market trading volume (25%), social media buzz (15%), market survey (15%), Bitcoin’s share of the entire market (10%), and Google keyword trend analysis (10%).
GateNews9h ago
Market Overreactions? MicroStrategy Founder: Bitcoin Has Hit Bottom, Quantum Threats Are Overblown Concerns
Michael Saylor asserted that Bitcoin has already completed a bottoming process when it reached $60k, and he believes concerns about threats from quantum computers are overstated. He predicts that in the future, Bitcoin will become the core of a digital credit system, and he noted that the market’s selling pressure is limited, which could help drive a new bull market. Mizuho also gave a positive assessment of the company’s future performance.
CryptoCity9h ago
