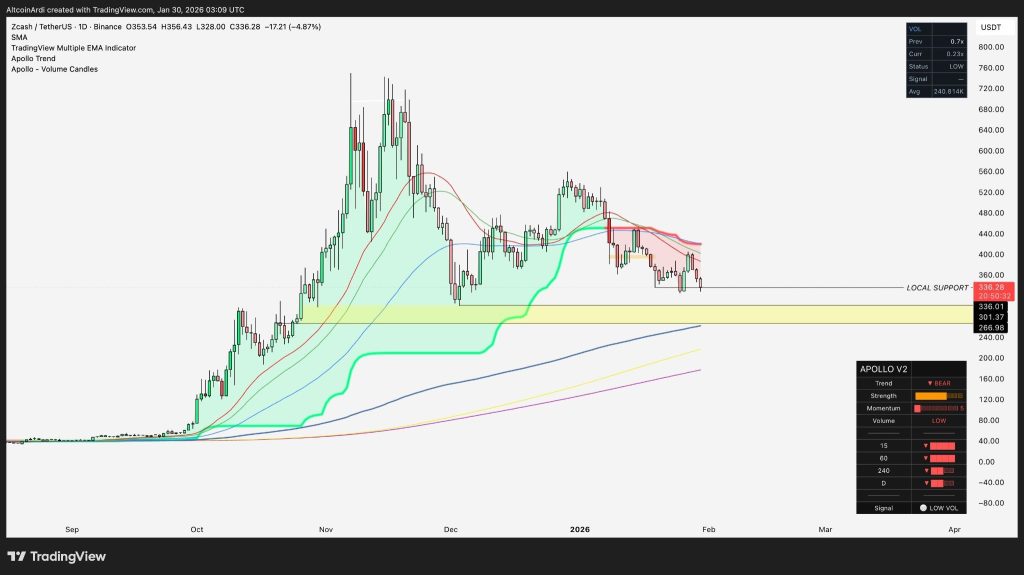
Zcash is starting to lean heavily on local support after another rough daily candle, with price hovering around $336. On the chart, that support line is basically the last thing stopping a deeper slide.
Price is also trading below the key moving averages, and the faster EMAs are stacked overhead, acting like a lid every time ZEC tries to move up.
The Apollo readout doesn’t help much either. Trend is marked as bear, and volume is still low. That usually means buyers aren’t stepping in with much confidence yet, which is why support levels like this tend to get tested again instead of producing an instant bounce.
ZEC Price Eyes the $300 Liquidity Zone
Ardi’s take is pretty direct. If this local support gives way, the ZEC price likely slides toward the $300 area. From a structure point of view, that makes sense. There’s not a lot of meaningful support between where price is now and that round-number zone.
It’s also not just about $300 exactly. The real area to watch is the broader $290–$300 range, which often acts like a liquidity pocket. If the ZEC price dips into that zone and snaps back quickly, it can turn into a classic flush-and-bounce move. If price drifts into it and struggles, the market usually starts looking lower pretty fast.
Source: X/@ArdiNSC
Another level that stands out is $310, which lines up with the 61.8% Fibonacci retracement of the move from $40 to the local highs. This is one of those levels where traders expect at least some kind of reaction.
If the ZEC price can’t bounce around $310 and the $290–$300 area doesn’t hold either, that’s when things start to feel heavier. At that point, the next logical downside area becomes the 200-day SMA near $270, which is the next clear technical reference on the chart.
Zcash (ZEC) Price Reaches a Key “Moment of Truth” – Is a Bullish Pennant Forming?_**
If Buyers Don’t Step In, $200 Comes Into View
This is where the risk really opens up. A weak response in the $290–$310 zone raises the odds of a much deeper pullback. In that scenario, the 78.6% Fibonacci level near $200 starts to come into play as a realistic downside target.
Right now, the ZEC price is sitting right at the decision point. Hold this local support and a bounce setup stays alive. Lose it cleanly, and attention shifts quickly to $310, then $300, with the big question being whether buyers finally step in with conviction or let price keep bleeding lower.
Disclaimer: The information on this page may come from third parties and does not represent the views or opinions of Gate. The content displayed on this page is for reference only and does not constitute any financial, investment, or legal advice. Gate does not guarantee the accuracy or completeness of the information and shall not be liable for any losses arising from the use of this information. Virtual asset investments carry high risks and are subject to significant price volatility. You may lose all of your invested principal. Please fully understand the relevant risks and make prudent decisions based on your own financial situation and risk tolerance. For details, please refer to
Disclaimer.
Related Articles
XRP Payments Fall 77% as Price Eyes End to Rally - U.Today
XRP's on-chain payment volume has dropped 77% to 86 million, signaling bearish momentum as its price stagnates below $1.35. This decline has raised investor concerns about potential volatility in the crypto market.
UToday45m ago
Shiba Inu Supply Locked Away as Ryoshi's Earlier Move Seals SHIB's Fate - U.Today
Shibizens highlights Shiba Inu's tokenomics, detailing how founder Ryoshi locked 50% of the supply in Uniswap for liquidity. This approach, including a significant burn by Vitalik Buterin, aimed for a fair launch, impacting SHIB's market price amid recent inflation data.
UToday1h ago
BTC Whale Inflows Drop, LTHs Accumulate Strongly
Recent data shows Bitcoin whale inflows to exchanges have dropped to below $3 billion, indicating reduced selling pressure. Meanwhile, long-term holders have accumulated $49 billion in Bitcoin, signaling a market transition. This shift suggests potential stability and reduced volatility, although macro factors could still affect prices.
Coinfomania2h ago
U.S.-Iran talks break down, BTC spikes then pulls back—how do geopolitical conflict and macro data affect the crypto market?
The breakdown of the nuclear talks between Iran and the U.S. caused Bitcoin to surge and then pull back, with the situation in the Strait of Hormuz and macroeconomic data becoming the focus. This article will explain the logic behind volatility in the crypto market amid geopolitical conflict and the movement of on-chain capital.
InstantTrends3h ago
The Crypto Fear and Greed Index rose to 16, and market panic sentiment eased slightly
Gate News update: On April 12, according to Alternative Data, today’s Crypto Fear and Greed Index is 16 (15 yesterday), and market panic sentiment has eased slightly. The index runs on a threshold of 0-100 and is calculated from six indicators: volatility (25%), market trading volume (25%), social media buzz (15%), market survey (15%), Bitcoin’s share of the entire market (10%), and Google keyword trend analysis (10%).
GateNews7h ago
Market Overreactions? MicroStrategy Founder: Bitcoin Has Hit Bottom, Quantum Threats Are Overblown Concerns
Michael Saylor asserted that Bitcoin has already completed a bottoming process when it reached $60k, and he believes concerns about threats from quantum computers are overstated. He predicts that in the future, Bitcoin will become the core of a digital credit system, and he noted that the market’s selling pressure is limited, which could help drive a new bull market. Mizuho also gave a positive assessment of the company’s future performance.
CryptoCity8h ago
