
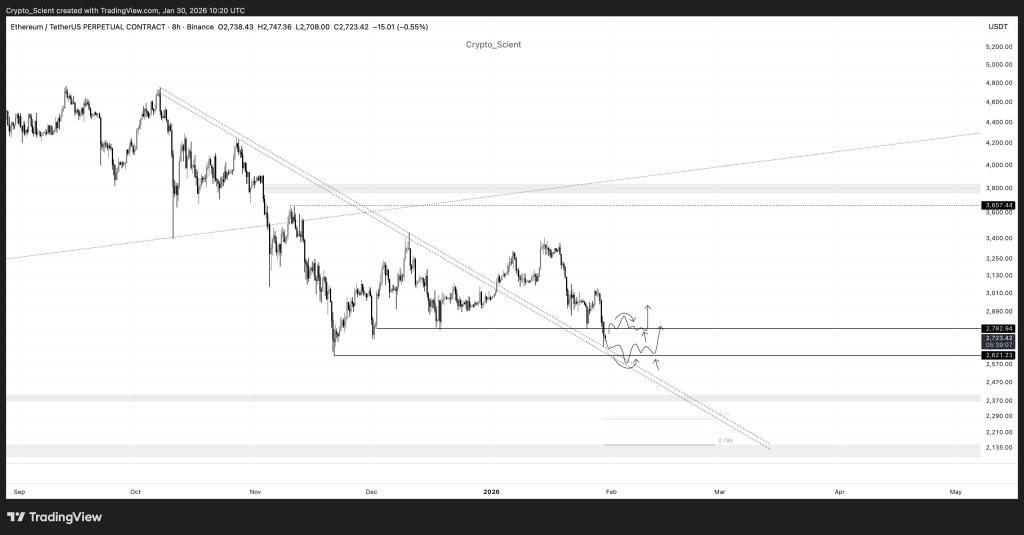
Ethereum price has spent recent sessions pressing into uncomfortable territory, with ETH price hovering near levels that already rejected several upside attempts this year. The chart shared by Crypto_Scient on X captures this tension clearly. Price continues to respect a broader downward structure, yet it is also approaching zones that historically invite sharp reactions rather than quiet continuation.
ETH now sits near a critical decision area where short-term direction could become clearer, even if volatility remains uneven through early February.
Ethereum price structure shows ETH moving within a tightening range that has been developing for weeks. Lower highs continue to form beneath a falling diagonal trendline, limiting upside progress. At the same time, downside moves have struggled to sustain follow-through below key horizontal demand.
Crypto_Scient notes $2,780 as a short term pivot for ETH price. This level previously acted as support before flipping into resistance. A clean break and hold above this zone would signal that sellers are losing control of the range. ETH reclaiming this area would place price back inside prior value and open room for further recovery attempts.
@Crypto_Scient / X
Failure to reclaim $2,780 keeps Ethereum price exposed to deeper tests. The structure suggests compression rather than immediate collapse. That setup often precedes sharper moves once liquidity is cleared.
ETH Price Liquidity Zone Near $2,620 Remains Critical
Attention shifts lower toward the $2,620 area, another level emphasized by Crypto_Scient. This zone sits beneath current price and aligns with visible liquidity from previous lows. ETH price dipping into this region would likely trigger stops clustered below support.
Crypto_Scient describes this as a potential stop hunt rather than a breakdown. The chart supports that view, showing diagonal trend support converging near this zone. A sweep below $2,620 followed by a quick reclaim would signal absorption rather than panic selling.
Such behavior would suggest sellers are exhausting themselves into demand. ETH price holding back above this level would reset risk and improve reward conditions for upside continuation.
Ethereum Price Structure Points Toward Expansion After Resolution
The broader chart structure hints that Ethereum price may be preparing for expansion once one of these triggers resolves. Compression between diagonal resistance and horizontal support rarely persists indefinitely. ETH price is nearing the apex of this structure.
Crypto_Scient notes that a successful liquidity sweep and base near trend support could fuel a larger expansion. The projected upside zone sits near $3,700 to $3,800 into February or March if conditions align. That target aligns with previous resistance zones visible on the chart.
A reclaim of $2,780 without a downside sweep would also change momentum dynamics. That outcome would indicate strength returning sooner than expected.
$5,000 in Hedera Now, What Could It Be Worth by 2027? HBAR Price Prediction_**
Ethereum price remains reactive rather than decisive at this stage. ETH continues to trade within a framework defined by clear technical levels rather than narrative momentum. Crypto_Scient emphasizes patience until one of the outlined triggers fires, a view supported by current structure.
The coming sessions will likely determine whether ETH price resolves through strength above resistance or liquidity clearance below support. Either path offers clarity once confirmed.
Disclaimer: The information on this page may come from third parties and does not represent the views or opinions of Gate. The content displayed on this page is for reference only and does not constitute any financial, investment, or legal advice. Gate does not guarantee the accuracy or completeness of the information and shall not be liable for any losses arising from the use of this information. Virtual asset investments carry high risks and are subject to significant price volatility. You may lose all of your invested principal. Please fully understand the relevant risks and make prudent decisions based on your own financial situation and risk tolerance. For details, please refer to
Disclaimer.
Related Articles
CTSI Price Soars 17.57%: Institutional Interest Ramps Up
Amid a crypto market downturn, CTSI surged 17.57% to $0.03626 in an hour, driven by high trading volume and institutional interest in altcoins. Traders are now watching key support and resistance levels for future price movements.
Coinfomania57m ago
Bitcoin falls below 71,500 USD, U.S.-Iran talks remain deadlocked, and the Strait of Hormuz becomes the biggest point of contention
On April 11, the U.S. and Iran began 20 hours of negotiations in Pakistan. The core issue was freedom of passage through the Strait of Hormuz. After Bitcoin briefly rose to $73,800, it quickly fell back to $71,557. The U.S. side took a hardline stance, demanding that Iran open the strait, while Iran insisted that easing restrictions must wait until a comprehensive agreement is reached. The two sides have not yet reached a consensus.
動區BlockTempo5h ago
Crypto Market Maintains Steady Growth Trajectory As Top Assets Show Gains
The crypto market continues to grow, with a market cap of $2.44T and Bitcoin and Ethereum showing slight increases. Top gainers include $GPM and $BASE. Meanwhile, DeFi TVL declined, NFT sales rose, and notable developments include a trader's significant loss and a push for regulatory clarity in Congress.
BlockChainReporter6h ago
BTC 15-minute chart slightly down 0.57%: leveraged long positions passively cut risk and macro sentiment disturbances drive volatility
2026-04-12 12:45 to 13:00 (UTC), the BTC price range was 71081.7 to 71493.2 USDT, with an amplitude of 0.58%. Within 15 minutes, the return recorded was -0.57%. During the period of unusual activity, market volatility increased somewhat, risk sentiment warmed up, and overall attention rose; however, there was no extreme surge in volume or a sudden drop in liquidity.
The main driver behind this unusual activity is that, under the leverage structure, long positions were reduced passively. Recently, the funding rate for perpetual contracts turned from negative to positive. Leverage among longs in the market accumulated; the price dipped slightly, triggering liquidations of some leveraged long positions and sell orders for position closures, resulting in
GateNews8h ago
Analyst: Bitcoin’s current pullback is relatively mild compared with past ones, but the bottom has not been confirmed yet.
Crypto analyst Axel Adler Jr said the current Bitcoin pullback is smaller than historic bearish-market levels, but a bottom has not yet been confirmed. He believes the market is still in a mild bear phase, and that a true recovery will require patience and waiting.
GateNews9h ago
Bitcoin long-term holdings increased to 12.4 million coins, and the 30-day change has remained positive.
CryptoQuant analyst Darkfost says the Bitcoin market is entering an early stabilization phase, with stronger long-term holding behavior. The amount of BTC held for more than a year has increased, and investors are more inclined to hold than to distribute. This suggests the market is transitioning toward long-term conviction; the current trend is viewed as an early stability signal, but it needs longer-term confirmation.
GateNews11h ago
