
Key Takeaways
The broader cryptocurrency market has once again slipped into a corrective phase after a strong start to the year. Bitcoin (BTC), which recently surged above the $95,000 mark, has pulled back sharply and is now trading below $88,000. Ethereum (ETH) has faced even heavier pressure, sliding more than 10% over the past week — a move that has weighed on major altcoins across the board.
Pudgy Penguins (PENGU) hasn’t been spared either. The token is currently down around 7% on the week. However, beneath the surface, PENGU’s price action is beginning to show a familiar and potentially bullish setup — one that closely resembles PEPE’s structure before its explosive breakout.
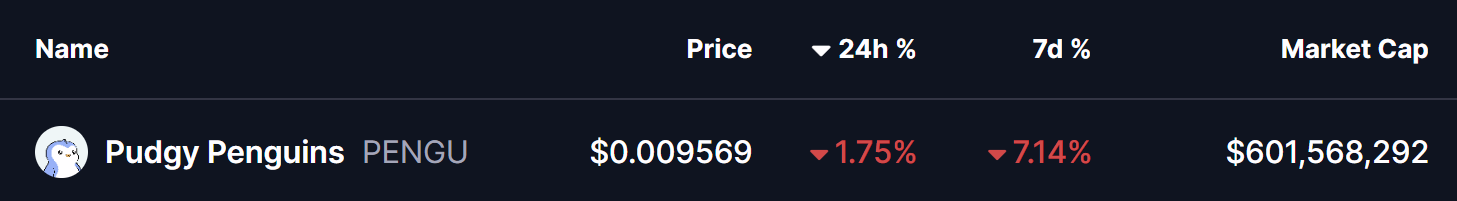
Source: Coinmarketcap
PENGU Mirrors PEPE’s Pre-Rally Structure
A side-by-side comparison of the PEPE and PENGU charts reveals striking similarities.
Back in late 2024, PEPE went through a sharp decline that eventually led to a bottoming formation. During this phase, price consolidated for an extended period inside a gray accumulation zone while forming a potential bearish Butterfly harmonic pattern. At the time, sentiment was muted and volatility remained compressed.
Once PEPE finally broke above that gray range, momentum flipped aggressively. The breakout triggered a powerful bullish reversal, sending PEPE more than 100% higher into December 2024.
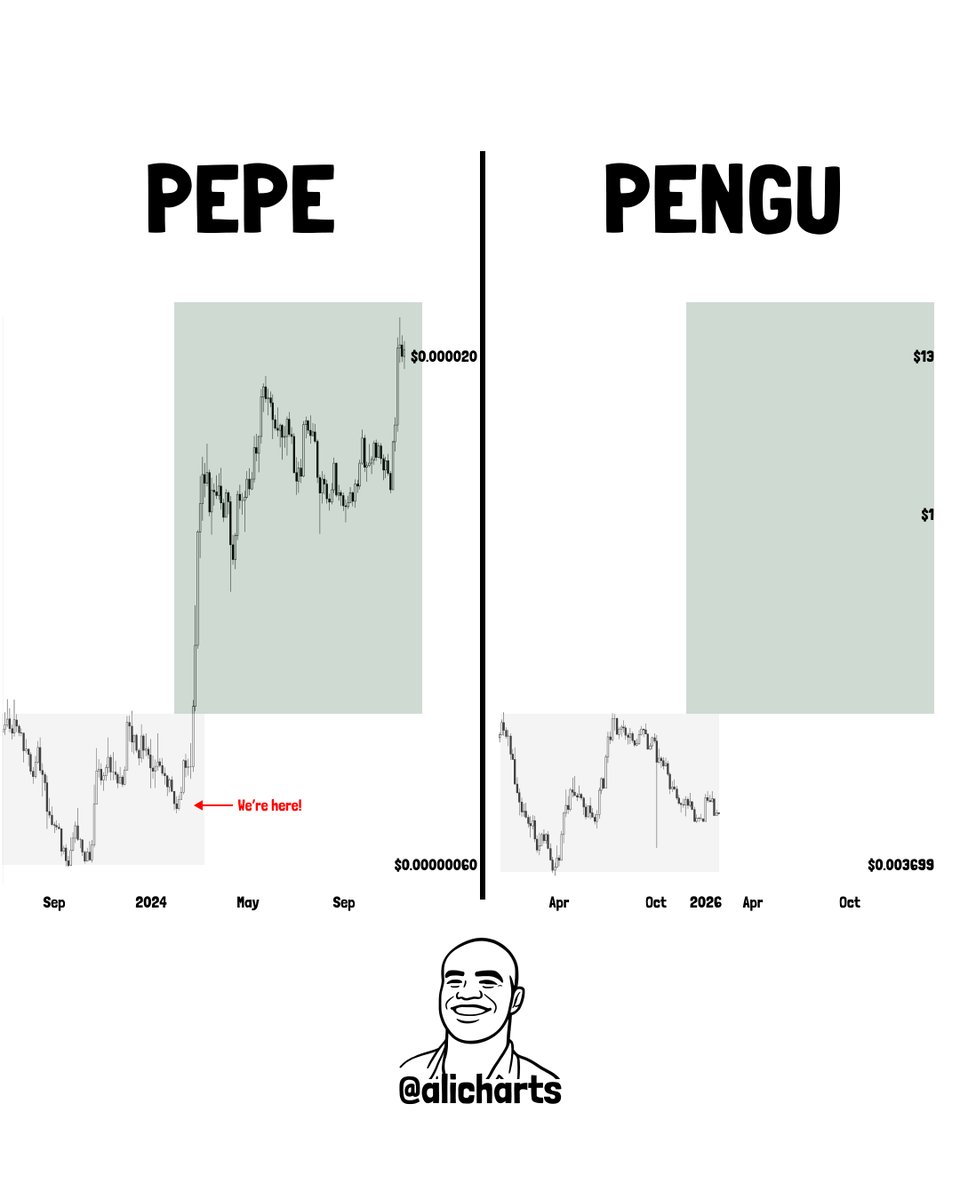
PEPE and PENGU Fractal Chart/Credits: @alicharts (X)
Now, PENGU appears to be following a remarkably similar path.
As shown on the right side of the chart, PENGU has also experienced a strong drop followed by a basing structure inside a gray consolidation zone. The price action suggests a potential bearish Butterfly harmonic pattern forming near the bottom — a setup that closely mirrors PEPE’s behavior just before its reversal.
What’s Next for PENGU?
If the PEPE fractal continues to play out, PENGU may be approaching the early stages of a trend reversal.
A decisive breakout above the gray zone resistance near $0.01382 would be a key confirmation signal. Such a move could open the door for a bullish continuation toward higher levels, with a potential upside target near $0.034, similar to PEPE’s post-breakout expansion.
That said, fractals are not guarantees — they are historical analogs, not certainties.
On the downside, a sustained drop below the $0.0084 support level would invalidate the fractal comparison and suggest that PENGU needs more time to build a durable base before any meaningful upside can materialize.
For now, PENGU sits at a technical crossroads. While broader market weakness continues to apply pressure, the chart hints that smart money may be quietly positioning ahead of a possible reversal. If momentum returns and the gray zone gives way, Pudgy Penguins could be setting up for its next major move — just as PEPE once did.
Disclaimer: The views and analysis presented in this article are for informational purposes only and reflect the author’s perspective, not financial advice. Technical patterns and indicators discussed are subject to market volatility and may or may not yield the anticipated results. Investors are advised to exercise caution, conduct independent research, and make decisions aligned with their individual risk tolerance.
About Author: Nilesh Hembade is the Founder and Lead Author of Coinsprobe, with over 5 years of experience in the cryptocurrency and blockchain industry. Since launching Coinsprobe in 2023, he has been providing daily, research-driven insights through in-depth market analysis, on-chain data, and technical research.
Disclaimer: The information on this page may come from third parties and does not represent the views or opinions of Gate. The content displayed on this page is for reference only and does not constitute any financial, investment, or legal advice. Gate does not guarantee the accuracy or completeness of the information and shall not be liable for any losses arising from the use of this information. Virtual asset investments carry high risks and are subject to significant price volatility. You may lose all of your invested principal. Please fully understand the relevant risks and make prudent decisions based on your own financial situation and risk tolerance. For details, please refer to
Disclaimer.
Related Articles
ETH 15-minute drop of 0.66%: short-term holders selling off in tandem with exchange net inflows amplifies the selling pressure
2026-04-12 22:00 to 22:15 (UTC), ETH showed a clear downward move in a highly liquid environment. The candlestick chart indicates a return of -0.66%, with price fluctuations ranging from 2186.76 to 2211.25 USDT, and a swing amplitude of 1.11%. Market attention rose rapidly, short-term sentiment turned cautious, and volatility intensified.
The main driving factors behind this unusual move are a sharp increase in exchange net inflows and concentrated selling by short-term holders. On-chain data shows that over the past 24 hours, net inflow of ETH into exchanges totaled 9,567.65 ETH, suggesting that a large amount of capital entered the market in the short term, potentially increasing selling pressure.
GateNews1h ago
CTSI Price Soars 17.57%: Institutional Interest Ramps Up
Amid a crypto market downturn, CTSI surged 17.57% to $0.03626 in an hour, driven by high trading volume and institutional interest in altcoins. Traders are now watching key support and resistance levels for future price movements.
Coinfomania2h ago
Bitcoin falls below 71,500 USD, U.S.-Iran talks remain deadlocked, and the Strait of Hormuz becomes the biggest point of contention
On April 11, the U.S. and Iran began 20 hours of negotiations in Pakistan. The core issue was freedom of passage through the Strait of Hormuz. After Bitcoin briefly rose to $73,800, it quickly fell back to $71,557. The U.S. side took a hardline stance, demanding that Iran open the strait, while Iran insisted that easing restrictions must wait until a comprehensive agreement is reached. The two sides have not yet reached a consensus.
動區BlockTempo7h ago
Crypto Market Maintains Steady Growth Trajectory As Top Assets Show Gains
The crypto market continues to grow, with a market cap of $2.44T and Bitcoin and Ethereum showing slight increases. Top gainers include $GPM and $BASE. Meanwhile, DeFi TVL declined, NFT sales rose, and notable developments include a trader's significant loss and a push for regulatory clarity in Congress.
BlockChainReporter8h ago
BTC 15-minute chart slightly down 0.57%: leveraged long positions passively cut risk and macro sentiment disturbances drive volatility
2026-04-12 12:45 to 13:00 (UTC), the BTC price range was 71081.7 to 71493.2 USDT, with an amplitude of 0.58%. Within 15 minutes, the return recorded was -0.57%. During the period of unusual activity, market volatility increased somewhat, risk sentiment warmed up, and overall attention rose; however, there was no extreme surge in volume or a sudden drop in liquidity.
The main driver behind this unusual activity is that, under the leverage structure, long positions were reduced passively. Recently, the funding rate for perpetual contracts turned from negative to positive. Leverage among longs in the market accumulated; the price dipped slightly, triggering liquidations of some leveraged long positions and sell orders for position closures, resulting in
GateNews10h ago
Analyst: Bitcoin’s current pullback is relatively mild compared with past ones, but the bottom has not been confirmed yet.
Crypto analyst Axel Adler Jr said the current Bitcoin pullback is smaller than historic bearish-market levels, but a bottom has not yet been confirmed. He believes the market is still in a mild bear phase, and that a true recovery will require patience and waiting.
GateNews11h ago
