
Key Takeaways
-
Ondo (ONDO) has recorded an all-time high TVL of $2.52 billion, rising over 31% in the past 30 days, signaling strong on-chain growth.
-
Active addresses, holders, and stablecoin market cap have all surged sharply, despite ONDO’s recent price correction.
-
The daily chart shows a right-angled descending broadening wedge, a structure that often appears near potential trend reversals.
The real-world asset (RWA) token Ondo (ONDO) has faced notable pressure in recent weeks, sliding nearly 13% over the past month amid the broader crypto market correction. However, while price action has remained under stress, on-chain data and chart structure tell a very different story — one that hints at growing accumulation and a potential bullish rebound forming beneath the surface.
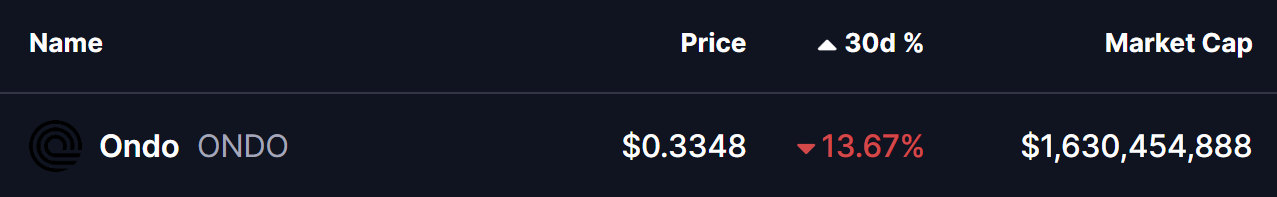
Source: Coinmarketcap
On-Chain Activity Surges Despite Price Weakness
According to the latest data from RWA.xyz, Ondo’s fundamentals continue to strengthen at an impressive pace. The protocol has now recorded an all-time high total value locked (TVL) of $2.52 billion, marking a 31.15% increase in just the past 30 days — a strong signal of rising institutional and on-chain demand.
Other key on-chain metrics are also trending higher:
-
Stablecoin market cap: $74.28 million, up 118% month-over-month
-
Total holders: 67,745, up 34.8% in 30 days
-
Monthly active addresses: 83,519, surging more than 210%
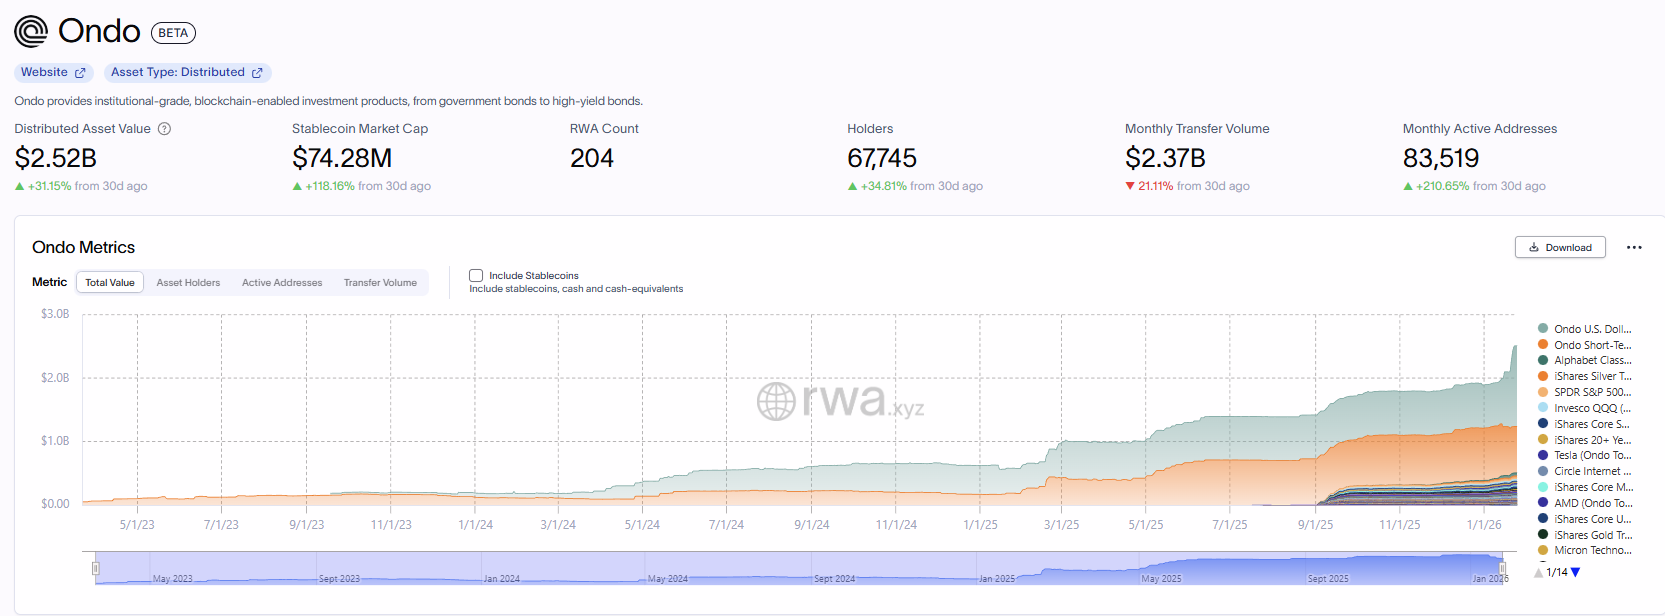
Source: rwa.xyz
This sharp rise in participation and capital flow suggests that users and institutions are increasingly engaging with Ondo’s RWA ecosystem, even as the token’s price consolidates near cycle lows.
Is a Bullish Rebound Taking Shape?
From a technical perspective, ONDO’s daily chart is carving out a right-angled descending broadening wedge — a structure commonly seen during prolonged corrections that can precede trend reversals once selling pressure begins to fade.
This pattern has been developing since ONDO’s rejection from the $1.00–$1.17 resistance zone in September 2025. Since then, price has continued to form lower highs, while volatility has expanded, driving ONDO toward the lower boundary of the wedge near $0.32.
Encouragingly, that support zone has now been successfully defended. Buyers have stepped in near the lower trendline, with ONDO currently hovering around $0.335, suggesting that downside momentum may be weakening after weeks of sustained selling.
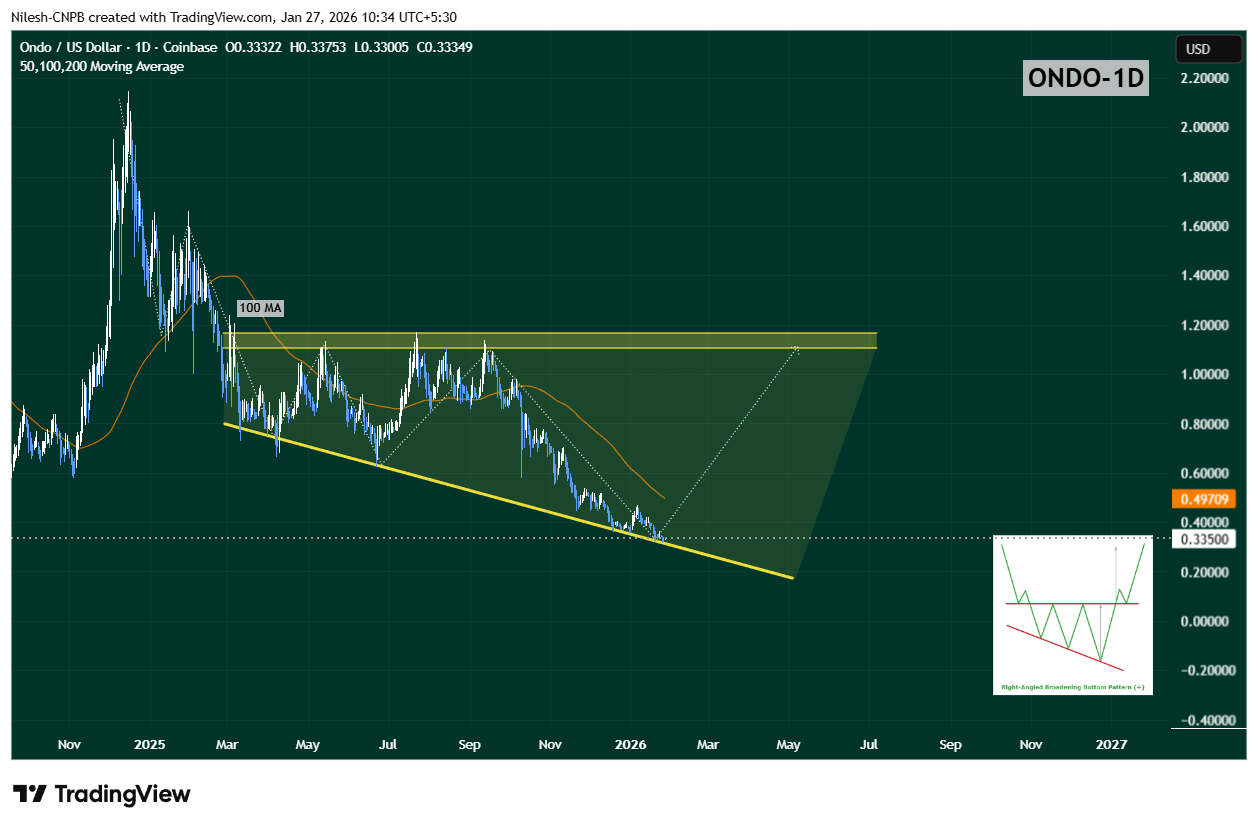
Ondo (ONDO) Daily Chart/Coinsprobe (Source: Tradingview)
Despite early stabilization, upside momentum remains capped for now. The 100-day moving average, sitting near $0.4970, has flipped into strong overhead resistance. Every prior relief rally has stalled below this level, making it a key hurdle for bulls.
Until ONDO can reclaim this moving average, any upside move should be treated as a relief bounce within consolidation, rather than a confirmed trend reversal.
What’s Next for ONDO?
As long as ONDO continues to hold above the $0.32 support zone, the right-angled descending broadening wedge remains valid. Sustained defense of this level keeps the door open for a recovery attempt, especially if price begins posting higher daily or weekly closes.
A reclaim of the 50-day moving average, followed by a breakout above the 100-day MA, would mark a clear shift in momentum. If that scenario plays out, ONDO could gradually advance toward the upper boundary of the wedge, currently aligning near the $1.10–$1.17 region — a move that would represent a major recovery from current levels.
However, a decisive breakdown below the wedge support would invalidate the bullish setup and likely lead to another phase of downside or extended consolidation.
Bottom Line
While ONDO’s price remains under pressure, the disconnect between price action and on-chain growth is becoming increasingly difficult to ignore. Record-high TVL, surging active addresses, and expanding holder counts suggest strong accumulation is taking place beneath the surface.
Combined with a technically constructive wedge pattern near long-term support, ONDO may be approaching a pivotal inflection point — one where fundamentals and structure align for a potential bullish rebound, provided key support levels continue to hold.
Disclaimer: The views and analysis presented in this article are for informational purposes only and reflect the author’s perspective, not financial advice. Technical patterns and indicators discussed are subject to market volatility and may or may not yield the anticipated results. Investors are advised to exercise caution, conduct independent research, and make decisions aligned with their individual risk tolerance.
About Author: Nilesh Hembade is the Founder and Lead Author of Coinsprobe, with over 5 years of experience in the cryptocurrency and blockchain industry. Since launching Coinsprobe in 2023, he has been providing daily, research-driven insights through in-depth market analysis, on-chain data, and technical research.
Disclaimer: The information on this page may come from third parties and does not represent the views or opinions of Gate. The content displayed on this page is for reference only and does not constitute any financial, investment, or legal advice. Gate does not guarantee the accuracy or completeness of the information and shall not be liable for any losses arising from the use of this information. Virtual asset investments carry high risks and are subject to significant price volatility. You may lose all of your invested principal. Please fully understand the relevant risks and make prudent decisions based on your own financial situation and risk tolerance. For details, please refer to
Disclaimer.
Related Articles
ETH 15-minute drop of 0.66%: short-term holders selling off in tandem with exchange net inflows amplifies the selling pressure
2026-04-12 22:00 to 22:15 (UTC), ETH showed a clear downward move in a highly liquid environment. The candlestick chart indicates a return of -0.66%, with price fluctuations ranging from 2186.76 to 2211.25 USDT, and a swing amplitude of 1.11%. Market attention rose rapidly, short-term sentiment turned cautious, and volatility intensified.
The main driving factors behind this unusual move are a sharp increase in exchange net inflows and concentrated selling by short-term holders. On-chain data shows that over the past 24 hours, net inflow of ETH into exchanges totaled 9,567.65 ETH, suggesting that a large amount of capital entered the market in the short term, potentially increasing selling pressure.
GateNews1h ago
CTSI Price Soars 17.57%: Institutional Interest Ramps Up
Amid a crypto market downturn, CTSI surged 17.57% to $0.03626 in an hour, driven by high trading volume and institutional interest in altcoins. Traders are now watching key support and resistance levels for future price movements.
Coinfomania2h ago
Bitcoin falls below 71,500 USD, U.S.-Iran talks remain deadlocked, and the Strait of Hormuz becomes the biggest point of contention
On April 11, the U.S. and Iran began 20 hours of negotiations in Pakistan. The core issue was freedom of passage through the Strait of Hormuz. After Bitcoin briefly rose to $73,800, it quickly fell back to $71,557. The U.S. side took a hardline stance, demanding that Iran open the strait, while Iran insisted that easing restrictions must wait until a comprehensive agreement is reached. The two sides have not yet reached a consensus.
動區BlockTempo7h ago
Crypto Market Maintains Steady Growth Trajectory As Top Assets Show Gains
The crypto market continues to grow, with a market cap of $2.44T and Bitcoin and Ethereum showing slight increases. Top gainers include $GPM and $BASE. Meanwhile, DeFi TVL declined, NFT sales rose, and notable developments include a trader's significant loss and a push for regulatory clarity in Congress.
BlockChainReporter8h ago
BTC 15-minute chart slightly down 0.57%: leveraged long positions passively cut risk and macro sentiment disturbances drive volatility
2026-04-12 12:45 to 13:00 (UTC), the BTC price range was 71081.7 to 71493.2 USDT, with an amplitude of 0.58%. Within 15 minutes, the return recorded was -0.57%. During the period of unusual activity, market volatility increased somewhat, risk sentiment warmed up, and overall attention rose; however, there was no extreme surge in volume or a sudden drop in liquidity.
The main driver behind this unusual activity is that, under the leverage structure, long positions were reduced passively. Recently, the funding rate for perpetual contracts turned from negative to positive. Leverage among longs in the market accumulated; the price dipped slightly, triggering liquidations of some leveraged long positions and sell orders for position closures, resulting in
GateNews10h ago
Analyst: Bitcoin’s current pullback is relatively mild compared with past ones, but the bottom has not been confirmed yet.
Crypto analyst Axel Adler Jr said the current Bitcoin pullback is smaller than historic bearish-market levels, but a bottom has not yet been confirmed. He believes the market is still in a mild bear phase, and that a true recovery will require patience and waiting.
GateNews11h ago
