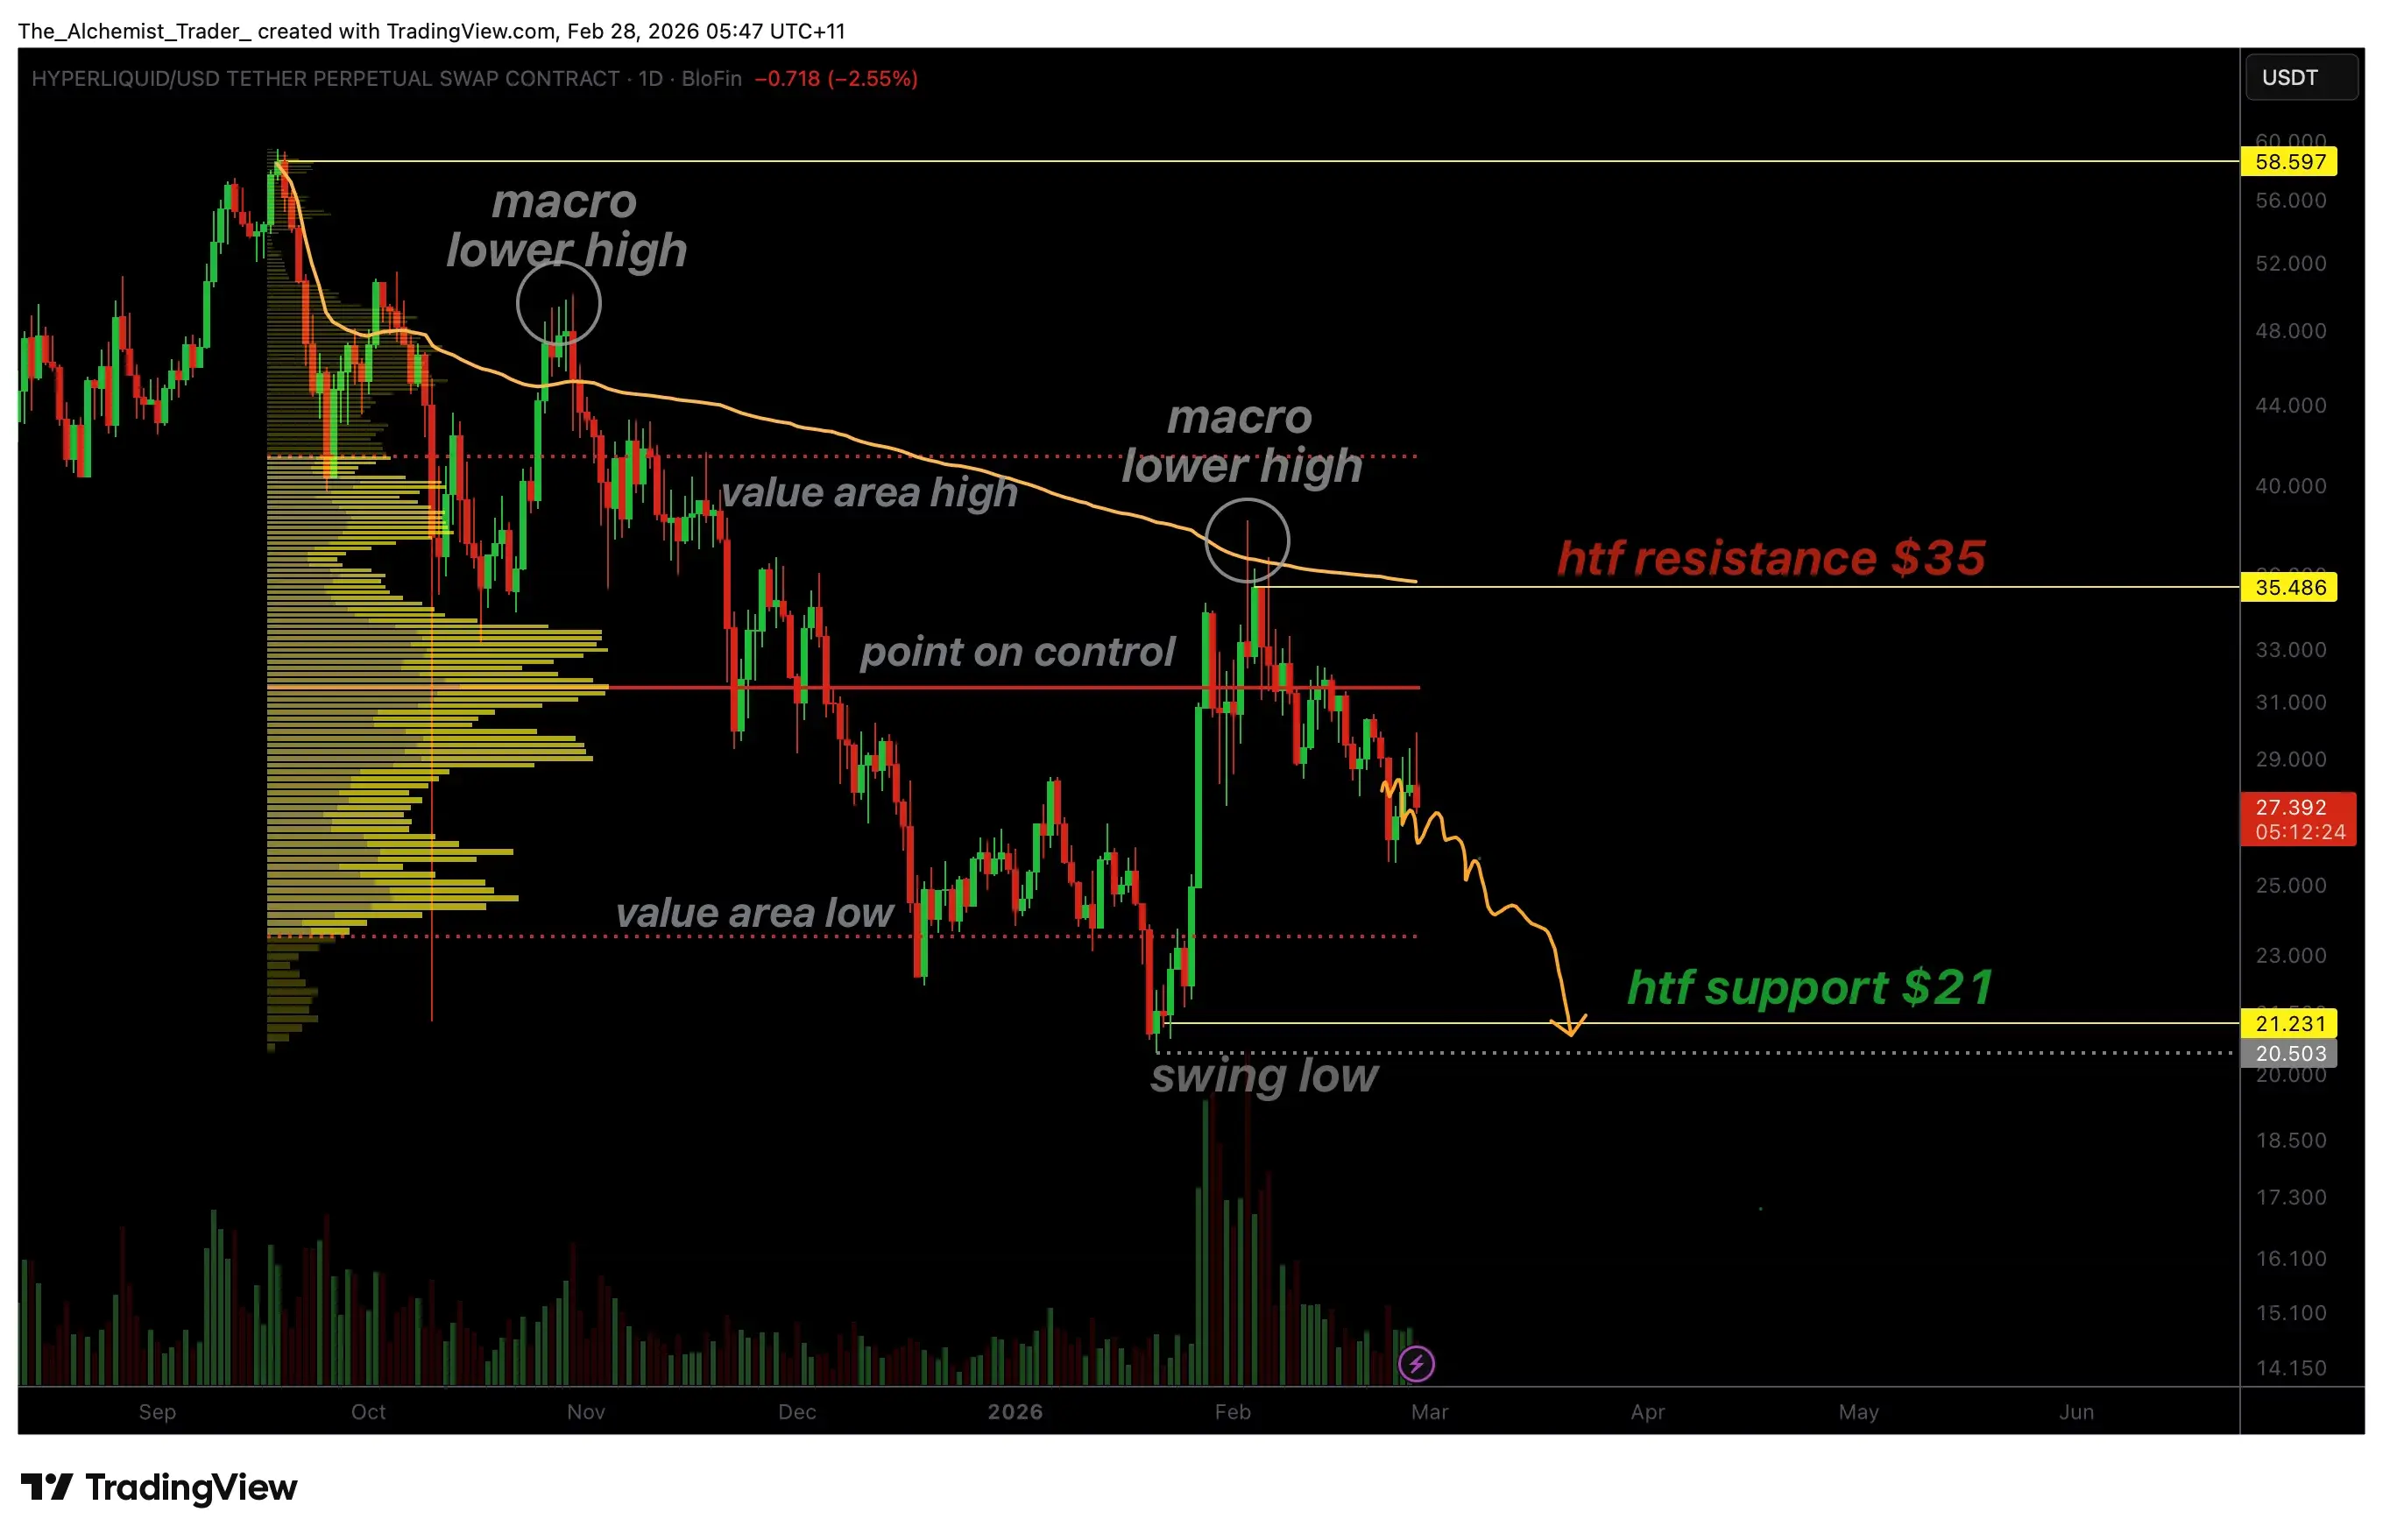
February 28 News: Hyperliquid’s price faces resistance at high levels again, forming a macro “lower high” structure, with ongoing correction pressure increasing. After failing to regain a key volume zone, technical indicators point to the next significant support area around $22.
From a higher time frame, Hyperliquid remains in a clear bearish structure. The price has rebounded multiple times but continues to make lower highs, with no substantial trend reversal. Recent rebounds around $35 encountered resistance at this level, which coincides with the volume-weighted average price (VWAP) and the high point of the value area, forming a strong resonance resistance zone. The price pulled back under pressure, indicating sellers still hold the dominant position.
After being blocked, the market retreated to the Point of Control (POC). The POC represents the most traded price area within the current range, often serving as a key dividing line between bulls and bears. However, Hyperliquid failed to stabilize above the POC and instead broke below this volume support, suggesting insufficient demand and increasing likelihood of trend continuation.
Following the loss of POC support, the market entered a new correction phase. Technical structure shows that if the price continues to trade below the POC and faces resistance at higher cycle levels, liquidity may shift down to the $22–$21 range. This zone is not only a previous swing low but also a potential phase panic release area, regarded as an important medium- to long-term demand test zone.
 (Source: TradingView)
For investors monitoring Hyperliquid’s price trend, whether $22 can form an effective support will be a key point in judging whether the trend will further deteriorate. A volume-supported rebound in this area could create conditions for subsequent structural recovery; if it fails to hold, deeper correction risks should be watched. Under the current technical landscape, the market remains cautious.
(Source: TradingView)
For investors monitoring Hyperliquid’s price trend, whether $22 can form an effective support will be a key point in judging whether the trend will further deteriorate. A volume-supported rebound in this area could create conditions for subsequent structural recovery; if it fails to hold, deeper correction risks should be watched. Under the current technical landscape, the market remains cautious.
Disclaimer: The information on this page may come from third parties and does not represent the views or opinions of Gate. The content displayed on this page is for reference only and does not constitute any financial, investment, or legal advice. Gate does not guarantee the accuracy or completeness of the information and shall not be liable for any losses arising from the use of this information. Virtual asset investments carry high risks and are subject to significant price volatility. You may lose all of your invested principal. Please fully understand the relevant risks and make prudent decisions based on your own financial situation and risk tolerance. For details, please refer to
Disclaimer.
Related Articles
SHIB Faces Critical Breakout Test as Forecast Points to Short-Term 7.47% Gain
Shiba Inu (SHIB) is trading close to the support level of $0.05545, showing a recent decline but also potential for a 7.47% upside by March 2026. The price remains within established boundaries, facing key resistance at $0.055727. Future movements depend on breaking above resistance or falling below support.
CryptoNewsLand39m ago
PEPE Price Coils Within $0.053385–$0.053517 Band as Momentum Stays Balanced
PEPE is trading within a tight range, with support at $0.053385 and resistance at $0.053517. The token shows minimal daily gains and balanced momentum indicators, indicating potential for volatility. Despite limited movement against USDT, PEPE appreciates against BTC and ETH.
CryptoNewsLand49m ago
DXY Breaks Above the Daily 200MA and Crypto Markets Are Watching the ~100 Level Like a Hawk
Currently, the U.S. Dollar Index (DXY) is starting to play a key role in crypto trading this morning. The Dollar has crossed above its Daily 200 period moving averages on March 1, 2026, and is now testing below its Daily 200 period Exponential Moving Averages. Daan Crypto Trades called attention to
BlockChainReporter57m ago
Bitcoin Death Cross Appears on Three-Day Chart, What Could Follow? - U.Today
Bitcoin recently formed a death cross on the three-day chart, which historically precedes significant bear market declines. This pattern suggests the potential for further downward movement in the current cycle, echoing past trends since 2014.
UToday1h ago
Short-selling firm Culper releases bearish report on Ethereum: Fusaka upgrade disrupts ETH token economics
Aggressive short-selling firm Culper Research has released a report bearish on Ethereum (ETH), believing that the Fusaka upgrade in 2025 will cause structural damage to ETH's token economy. The report points out that a significant decrease in Gas fees has led to increased address pollution attacks and reduced validator rewards, and emphasizes that Ethereum is facing competitive pressure from Solana and L2 solutions. Culper believes that ETH's value capture ability is declining and has started shorting ETH.
ChainNewsAbmedia3h ago
Geopolitical Turmoil! Dalio Declares "Gold is the Only True God," but Its Safe-Haven Performance Trails Bitcoin
As geopolitical tensions in the Middle East escalate, Bridgewater founder Ray Dalio questions Bitcoin and reaffirms gold as the preferred safe haven. Nevertheless, gold prices fell accordingly, while Bitcoin only experienced a slight correction, indicating that the correlation between the two is weakening. Dalio doubts Bitcoin's transparency and future risks, but he still maintains a small allocation of Bitcoin for diversification.
区块客3h ago