Decred (DCR) is maintaining an impressive breakout momentum, increasing by an additional 5% at the time of writing on Monday, marking its fifth consecutive rally. This upward trend occurs amid bullish efforts to challenge a key resistance zone in the market.
Notably, the limited circulating supply—stemming from continuous user staking and persistent treasury accumulation—is creating significant upward pressure on DCR’s price. From a technical perspective, Decred is at a critical juncture, as increasing buying pressure could determine the next direction of the trend.
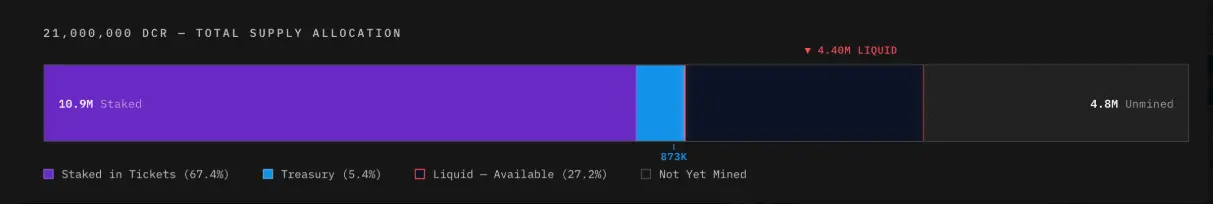
Limited Supply Drives DCR Demand
On-chain data shows that 10.9 million DCR are currently staked, accounting for 67.4% of the total mined supply (16.2 million DCR) and locked for 142 days. Additionally, the treasury holds over 873,000 DCR, removing another 5.4% from the circulating supply and reducing actual market liquidity to approximately 4.40 million DCR. This scarcity of supply is significantly boosting demand, attracting increasing investor interest in this privacy-focused coin.
 DCR Supply Distribution | Source: Decred.supply## Technical Outlook: Will Decred Continue Its Uptrend?
Decred has gained about 5% at the time of writing on Monday, breaking above the $25.00 level. The short-term recovery is currently challenging the 38.2% Fibonacci retracement at $26.13, calculated from the November 4 high of $70 down to the December 23 low of $14.21. This is a key resistance zone that has repeatedly halted upward attempts since late November, reflecting ongoing significant selling pressure.
If the price can convincingly close above the $26.13 level, the bullish trend may be reinforced, opening the door toward higher Fibonacci retracement levels at $31.54 (50%) and $38.07 (61.8%).
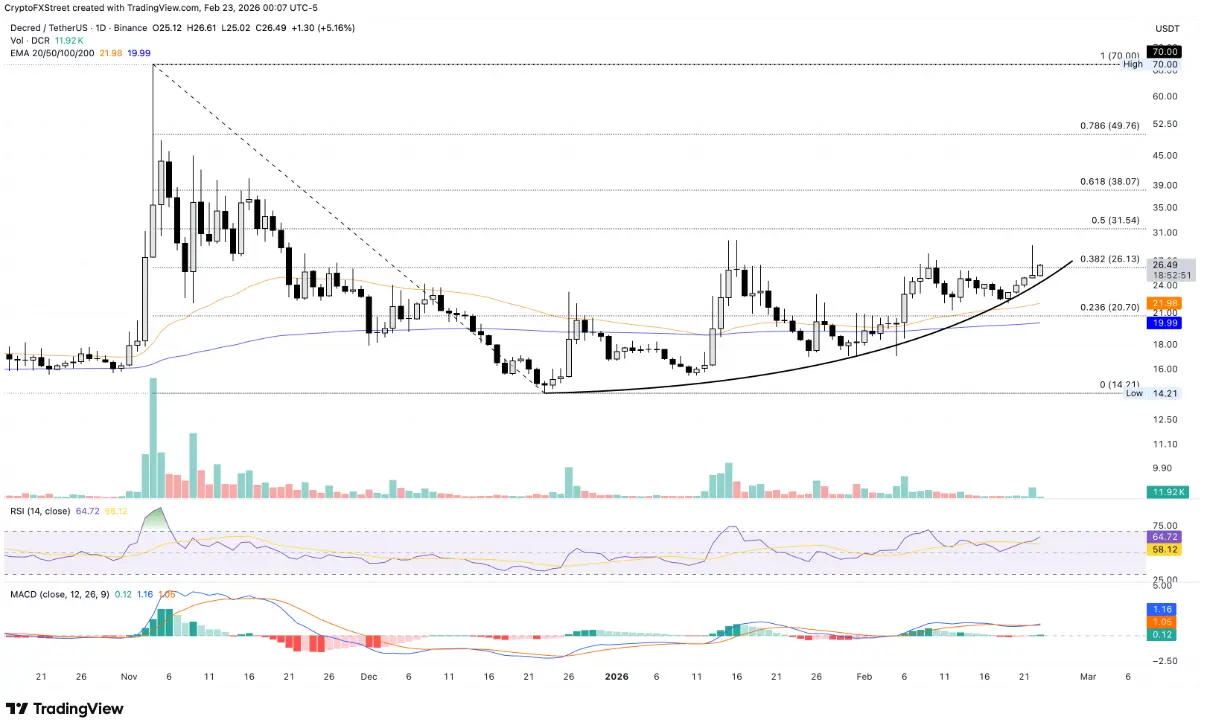 Daily DCR/USDT Chart (Logarithmic) | Source: TradingView In terms of momentum, the Relative Strength Index (RSI) on the daily timeframe is around 63 and continues to rise, indicating increasing buying strength and a sustained recovery from the neutral zone. More importantly, the RSI still has room to grow before entering overbought territory, supporting the scenario of continued price advancement. Additionally, the MACD line has crossed above the signal line, signaling positive momentum and the potential formation of a new bullish impulse.
Conversely, if the price fails to break above and reverses from the $26.13 zone, a correction scenario could unfold, with Decred retreating to test the 50-day Exponential Moving Average (EMA) around $21.96.
Disclaimer: The information on this page may come from third parties and does not represent the views or opinions of Gate. The content displayed on this page is for reference only and does not constitute any financial, investment, or legal advice. Gate does not guarantee the accuracy or completeness of the information and shall not be liable for any losses arising from the use of this information. Virtual asset investments carry high risks and are subject to significant price volatility. You may lose all of your invested principal. Please fully understand the relevant risks and make prudent decisions based on your own financial situation and risk tolerance. For details, please refer to
Disclaimer.
Related Articles
Analyst Says Hedera (HBAR) Is Worth Watching Again – Here’s the Reason
Crypto analyst Lucky observes that HBAR is currently in a demand zone after breaking a downtrend line, indicating a potentially favorable risk-reward scenario for buyers. He highlights key price levels for future market movements.
CaptainAltcoin2m ago
Bitcoin Has Stabilized, But Investors Are Paying Up for Downside Protection: VanEck
Bitcoin's volatility has decreased to around $70,000, but traders are still heavily investing in downside protection. Although premiums for puts have dropped, they remain high historically, suggesting caution among investors. This defensiveness may signal an impending price bottom, as similar market conditions in the past have led to recoveries.
Decrypt6m ago
Why Gold Price Is Falling Even With Global Tension Escalating?
The essay discusses the unexpected decline in gold prices due to a strong dollar driven by rising oil prices and inflation. As the Federal Reserve refrains from rate cuts, gold becomes less attractive compared to interest-bearing investments. This situation prompts investors to consider Bitcoin as a potential new digital gold, indicating a shift in traditional asset preferences amidst evolving market conditions.
CaptainAltcoin2h ago
Why Aksel Kibar Believes Bitcoin Price Is Trap and This 'Rising Wedge' Signals Deeper Drop - U.Today
Analyst Aksel Kibar warns Bitcoin investors that the current price recovery is a technical trap within a downtrend. He identifies a "rising wedge" pattern and predicts potential declines to $60,000 or lower, advising caution against misinterpreting short-term fluctuations.
UToday4h ago
US Bitcoin Spot ETF Attracts Inflows for Seven Consecutive Days, Institutional Funds Return
U.S. cryptocurrency spot ETFs have recently seen a warming in capital inflows, particularly ahead of the Federal Reserve's interest rate decision, as investor interest in digital assets has rebounded. Bitcoin and Ethereum spot ETFs have recorded net inflows for multiple consecutive days, with Bitcoin attracting $199.4 million in a single day, marking a record of seven consecutive days of inflows. This phenomenon reflects increased institutional capital allocation, with market structure showing that investors are increasingly inclined to invest through regulated products, strengthening market support.
区块客4h ago
